Results from the 2025 WA State Syringe Services Program Health Survey
Alison Newman, MPH, Caleb J. Banta-Green, PhD, MPH, MSW, Sara N. Glick, PhD, MPH, Joe Tinsley, Courtney Moreno, with contributors Nicole Branche, Leif Layman, MPH, and Jason Williams. Seattle, WA: Addictions, Drug & Alcohol Institute, Department of Psychiatry & Behavioral Sciences, School of Medicine, University of Washington, April 2026.
Key findings
- Syringe services programs (SSPs) provide a broad range of supplies and services, including safer drug use supplies as well as naloxone, wound care, and hygiene supplies. Participants are interested in additional services at SSPs such as drug checking (53%), and physical (75%) and mental health care (69%).
- Methamphetamine remains the most frequently used drug (90%), followed by fentanyl (60%).
- Over half of SSP participants surveyed were unhoused, and a quarter had temporary or unstable housing.
- Most people who used opioids (72%) or stimulants (62%) wanted to reduce or stop their substance use.
- A substantial minority of respondents who used opioids were interested in methadone as a treatment medication (42%), with somewhat lower interest in buprenorphine (26%).
- Utilization of smoking supplies was high at programs that provide them, and interest was high among sites that do not.
- Many using stimulants were interested in medications that might help reduce use (39%) and/or help with their mental health (33%).
Syringe services programs (SSPs) in Washington State
There are nearly 40 syringe services programs (SSPs) operating across 30 counties in Washington State. SSPs operate in brick-and-mortar sites; in mobile settings using vans, cars, and RVs; and through street outreach. The services they provide and hours they are open vary greatly.
Learn more
Survey overview and methods
The WA State Syringe Services Program Health Survey is conducted every two years among participants of SSPs to learn about their substance use, health behaviors, substance use disorder treatment, and other service needs.
The survey is coordinated by the Center for Community-Engaged Drug Education, Epidemiology & Research (CEDEER) at the University of Washington’s Addictions, Drug & Alcohol Institute (ADAI), in collaboration with Public Health-Seattle & King County (PHSKC) and with support from the Washington State Department of Health (DOH).
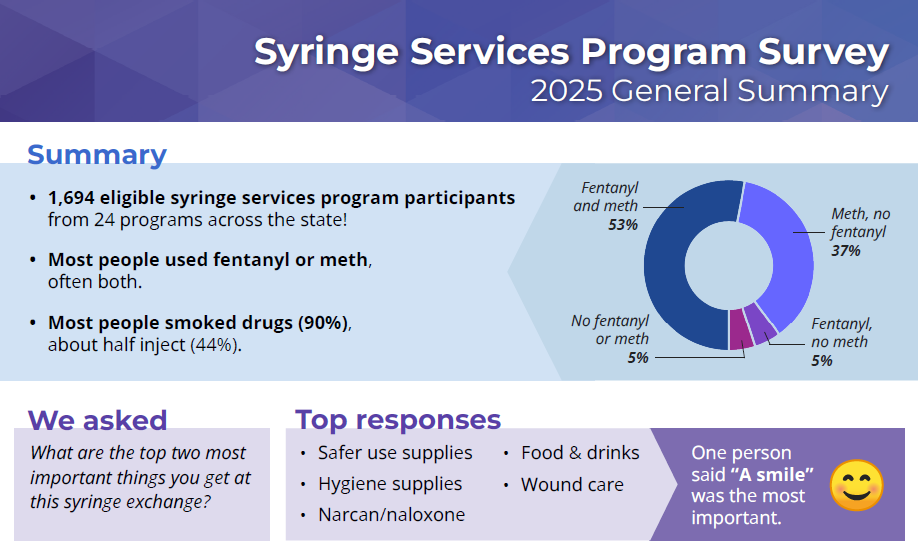
In 2025, 24 organizations working in 24 counties chose to participate in the survey, including one Tribal SSP. Surveying was conducted from September-November. Participation was voluntary, and participants received a $10 gift card (provided by DOH) for completing the survey. Survey was administered by SSP program staff and volunteers, either on paper or online using RedCAP.
Survey eligibility: Past week use of methamphetamine, fentanyl, heroin, or cocaine, or current or past-12-month use of medications for opioid use disorder (MOUD).
- 1,759 surveys conducted
- 65 excluded due to ineligibility
- Total: 1,694
Survey results
Drug use
Participants were asked about their past-week drug use, how many days each drug was used, and how many days the drug was smoked or injected.
Figure 1. Which of these drugs have you used in the last 7 days? and mean days used
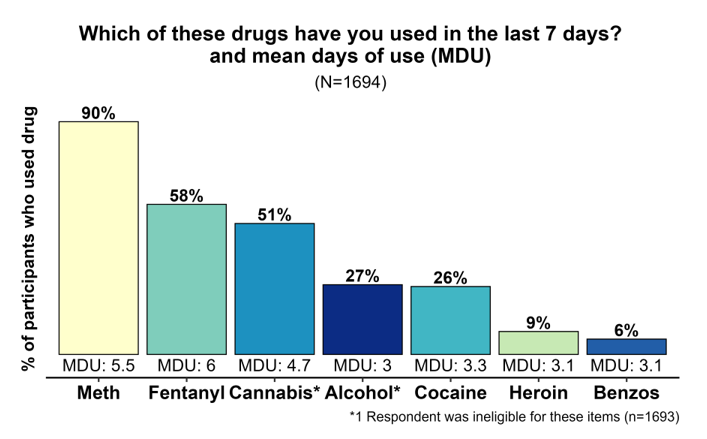
A substantial majority of participants reported using stimulants in the past week (96%), and well over half had used opioids in the past week (61%). Sixty percent reported using both opioids and stimulants in the past week.
Table 4. Which of these drugs have you used in the last seven days?
| n | % | Days of use | ||
|---|---|---|---|---|
| mean1 | median1 | |||
| Methamphetamine | 1,519 | 90% | 5.5 | 7 |
| Fentanyl | 975 | 58% | 6 | 7 |
| Cannabis | 844 | 50% | 4.7 | 5 |
| Alcohol | 443 | 26% | 3 | 2 |
| Cocaine or Crack | 442 | 26% | 3.3 | 2 |
| Heroin | 144 | 9% | 3.1 | 2 |
| Downers or Benzos | 99 | 6% | 3.1 | 2 |
| Kratom or 7-OH | 14 | 1% | 2.3 | 1.5 |
| 1Among those who used at least one day in last seven days | ||||
Methamphetamine was the most frequently used drug in the past week (90%) and a quarter (26%) had used cocaine. Methamphetamine and cocaine are used quite differently, with the median number of days used for methamphetamine being 7 (i.e., daily) compared to 2 for cocaine. Fentanyl was the second most commonly used drug, reported by 58% of respondents, while only 9% reported past-week heroin use, a substantial shift from the 2021 survey, when 69% of respondents reported using heroin in the past week. Another notable difference in these data is that the median days of use for fentanyl was seven compared to two for heroin.
Cannabis use was prevalent among participants, with half (51%) reporting past-week use. Alcohol was used in the past week by a quarter of respondents.
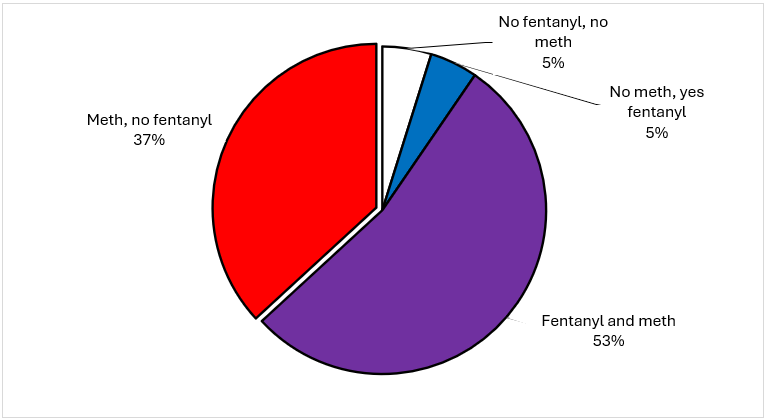
Half of participants (53%) reported using both fentanyl and methamphetamine in the past week, and 37% reported using methamphetamine only and no fentanyl. Five percent of people reported using fentanyl and no methamphetamine, and another 5% reported not using either in the past week.
Figure 2. Fentanyl and methamphetamine use
Participants were asked to identify a “main drug”; this could be the drug they used most frequently or the drug they prefer. Methamphetamine and fentanyl were identified as a “main drug” by 37% and 41% of people respectively. Cannabis was identified by 9% of participants as their “main drug,” all of whom also used opioids or stimulants.
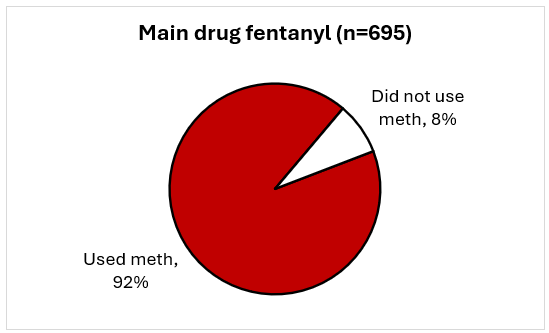
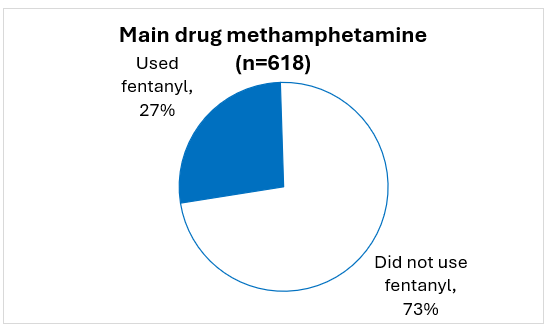
Figure 3. Which of these is your MAIN drug?
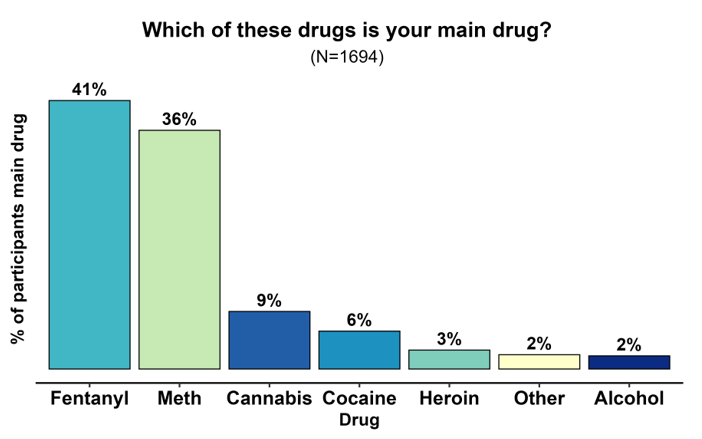
There were large differences in patterns of use based on participants’ main drug. Among those whose “main drug” was fentanyl, 92% had also used methamphetamine in the past week. Among those whose main drug was methamphetamine, 27% had used fentanyl.
Figure 4. Methamphetamine and fentanyl use by main drug
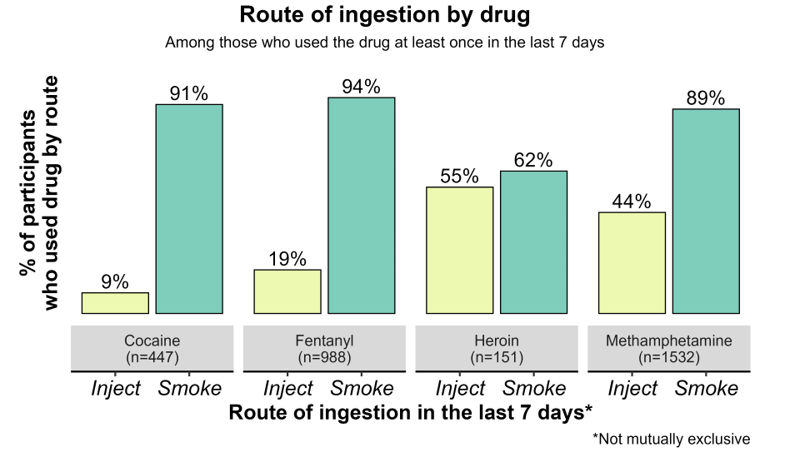
Route of ingestion: Smoking and injecting
Smoking was the most commonly reported route of ingestion, followed by injecting, though proportions varied by substance.
Ninety percent of respondents reported smoking opioids or stimulants in the past week.
Forty-four percent reported injecting a drug in the past week, and 53% had injected in the past three months. Among those with past-three-month injection, 17% reported sharing syringes.
Figure 5. Route of ingestion by drug
SSP visits and supplies
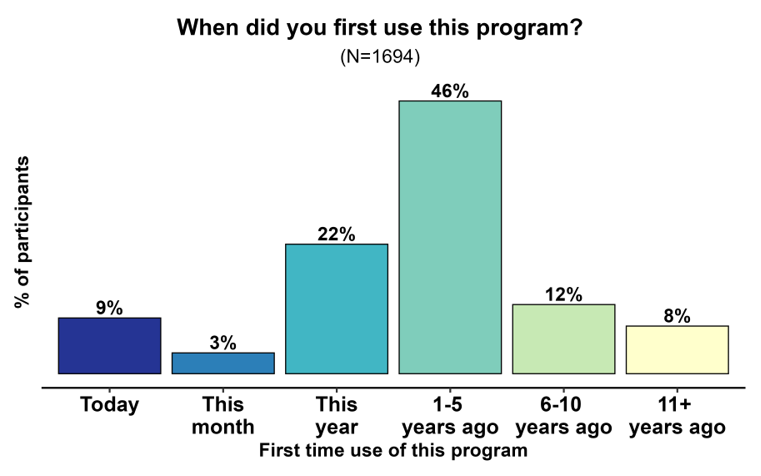
Most people (80%) had first started using the SSP in the past five years.
Figure 6. When did you first use this program?
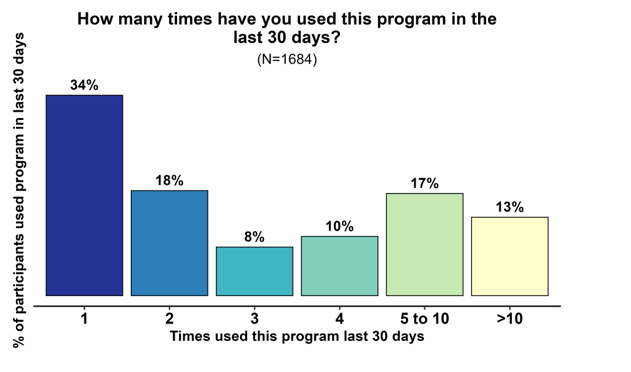
Most participants (66%) had used the program at least twice in the past month. Programs vary by how many days they are open, ranging from 1-5 days a week, so these numbers may not reflect the demand for services.
Figure 7. How many times have you used this program in the past 30 days?
People obtained a wide range of supplies at their SSP, including safer use supplies, as well as other supplies related to health.
Figure 8. Which of these supplies have you gotten from this syringe exchange in the past month?
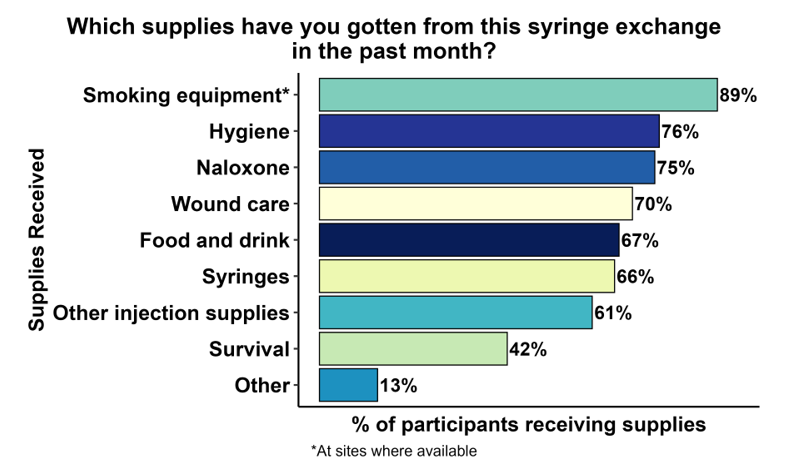
*Survival supplies include clothing, tents, backpacks
Popular supplies included syringes and other injection supplies, smoking supplies (at sites that provided them), hygiene supplies, naloxone (Narcan), food and drinks, and survival supplies.
Figure 9. What are the top two things you get at this program?
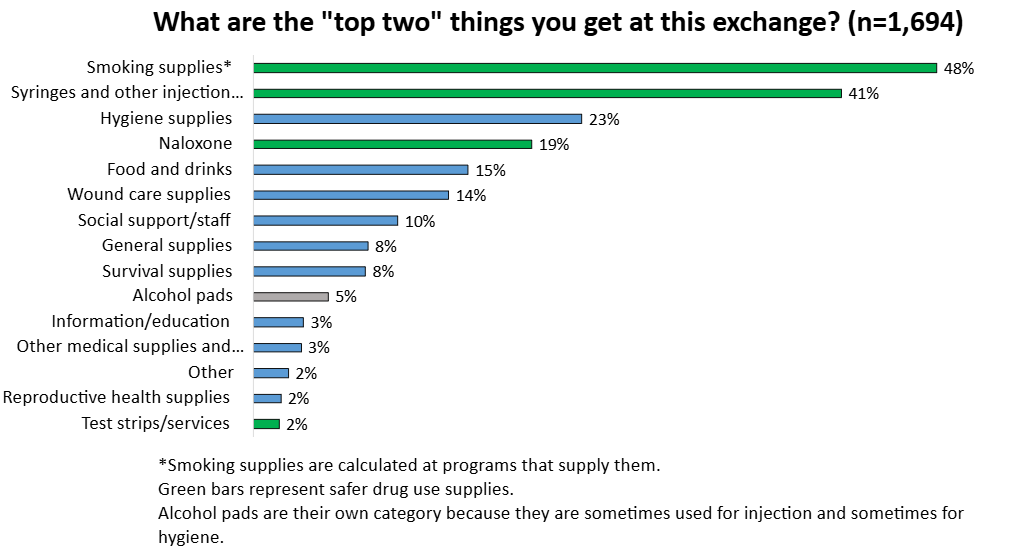
Participants were asked about the top two “most important things” they “get” at the SSP in the past month. Top responses were smoking supplies (at sites that provide them), syringes and other injection supplies, hygiene supplies, naloxone (Narcan), food and drinks, and wound care. Social support and positive interactions with staff were also identified as important, for example, “People are dedicated and make me feel welcome.”
Smoking supplies
Smoking supplies are provided at many SSPs throughout Washington State. Learn more about how smoking supplies support public health in our Distribution of Safer Drug Smoking Supplies as a Public Health Strategy brief (2022, revised 2025).
Among the SSPs that participated in the survey, several do not currently provide smoking supplies. However, receipt of smoking supplies is high at sites that do provide them, and interest is high at sites that don’t. To gauge interest in these supplies, we asked separate questions of sites that do or do not provide safer smoking supplies.
Sites with smoking supplies
At sites that provide safer smoking supplies (1,262 participants at 13 programs), almost all participants (89%) reported obtaining those supplies (Figure 8), and they were identified as one of the most important supplies at the SSP (Figure 9).
Fifty-nine percent of participants said smoking supplies were the reason they first came to this program, among those who first visited the program in the past 5 years. (This time frame was selected because smoking supplies have only become widely available in the past five years in Washington State.)
Sites without smoking supplies
At sites that did not provide smoking supplies (432 participants at 11 programs), 87% of respondents said they knew someone who would “come to this program if smoking supplies were available.”
Eighty-three percent said they would “like to get free, clean pipes or foils to smoke opioids, cocaine, or meth.” Of those who were interested in safer smoking supplies and injected, “75% said they would “inject less often” if smoking supplies were available.
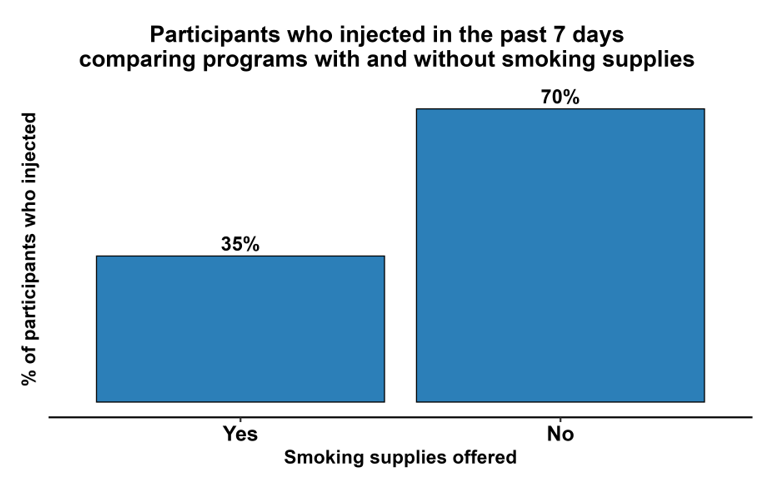
Injection and smoking rates at sites with and without smoking supplies
Participants at sites without smoking supplies were more likely to have injected in the past week (70%) than those at sites with smoking supplies (35%); this finding is important in the context of the paragraph above. The difference in smoking rates was smaller, 78% at sites without smoking supplies, and 70% at sites with safer smoking supplies, perhaps because alternatives such as aluminum foil are readily available elsewhere.
Table 5. Comparison of route of ingestion at sites with and without smoking supplies
| Past week smoking | Past week injection | |
|---|---|---|
| Sites with smoking supplies (n=1,262) | 94% | 35% |
| Sites without smoking supplies (n=432) | 78% | 70% |
Figure 10. Past week injection by whether the program offers safer smoking supplies
Opioid overdose and naloxone
Among people who used opioids, 19% had an overdose in the past three months. This compares with previous years when heroin was the dominant opioid and 22% of participants reported an overdose in the past 12 months (UW ADAI, 2021).
Figure 11. In the past 3 months how many times have you overdosed on opioids?
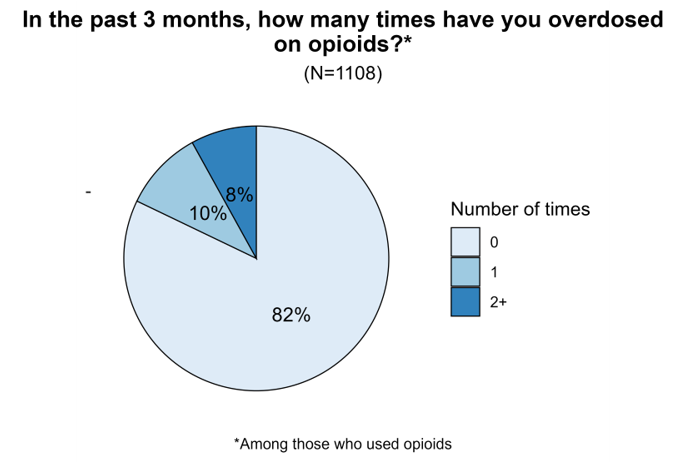
Naloxone access was very high among SSP participants; 83% reported carrying a naloxone kit at some point in the past three months, and 75% had obtained a kit at their SSP in the past month.
Health and healthcare: Insurance, HCV, HIV
The large majority of participants (92%) had health insurance, primarily Medicaid (85%).
Table 8. What kind of health insurance do you have?
| n | % | |
|---|---|---|
| Medicaid/Apple Health | 1,439 | 85% |
| None | 139 | 8% |
| Some other type | 111 | 7% |
| Not sure/No answer | 21 | 1% |
Half (50%) of participants reported that there was a time in the last 12 months when they thought they “should see a health care provider for a serious issue” but they did not go.
Figure 12. Hepatitis C testing and treatment cascade
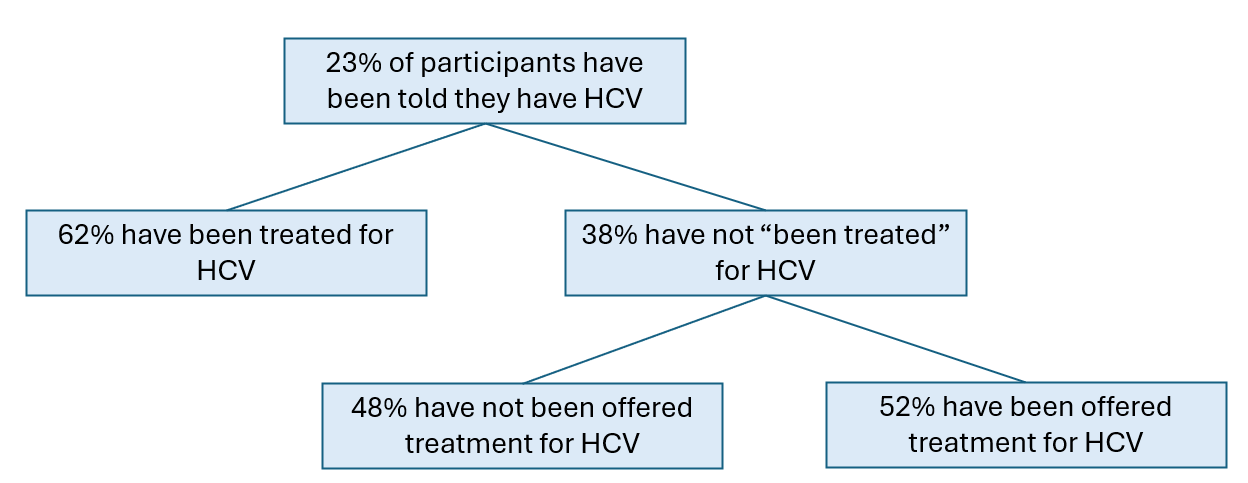
Nearly a quarter (23%) of participants had been diagnosed with hepatitis C; of those, 62% had been treated, and 52% of untreated participants had been offered treatment.
Learn more
- Hepatitis C Free Washington Plan (WA DOH)
HIV testing was prevalent among participants; 50% had been tested in the past year and 39% had been tested over a year ago.
Table 9. How long ago was your last HIV test?
| n | % | |
|---|---|---|
| Within past year | 842 | 50% |
| Over a year ago | 657 | 39% |
| Never tested | 127 | 8% |
| Not sure/No answer | 66 | 4% |
Emergency department visits
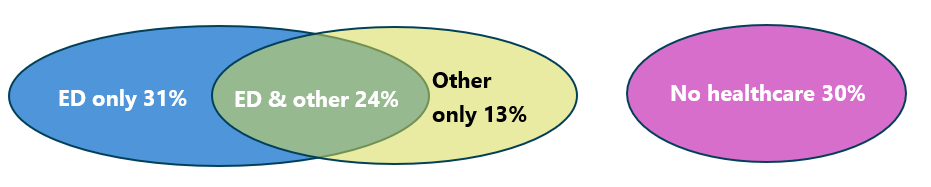
Most participants (57%) had been seen in the emergency department (ED) in the past year, 36% reported going to the ED two or more times.
Table 10. In the last 12 months, how many times have you been to the ER?
| # visits | n | % |
|---|---|---|
| 0 | 727 | 43% |
| 1 | 345 | 20% |
| 2 | 271 | 16% |
| 3 | 122 | 7% |
| 4+ | 220 | 13% |
Of all participants, 31% had only been seen in the emergency department, and 30% had received no healthcare in the past year.
Figure 13. Emergency department and other health care utilization
Participants who had been to the emergency department were asked additional questions about their experiences. Among those who used opioids, 23% were offered “to start or continue Suboxone (buprenorphine)“ the last time they were in the ED, and 26% were offered “Narcan (naloxone) before you left.” One consideration: participants may not have disclosed their opioid use to healthcare providers in the ED or may have visited due to medical issues unrelated to their opioid use.
Table 11. Provision of buprenorphine or naloxone in the ED, among participants who used opioids and had been in the ED in the past year (n=569)
| n | % | |
|---|---|---|
| Buprenorphine offered in the ED | 129 | 23% |
| Naloxone offered in the ED | 150 | 26% |
Learn more
- Learn more about strategies to increase the provision of MOUD in the ED through ScalaNW
- Washington State requirements on the provision of naloxone in the ED (WA HCA)
SUD treatment use
Fewer than half (45%) of participants had received “drug treatment in the past 12 months.” Methadone was the most frequent treatment participants had received (21%).
Figure 14. In the past 12 months, what types of drug treatment, if any, did you get?
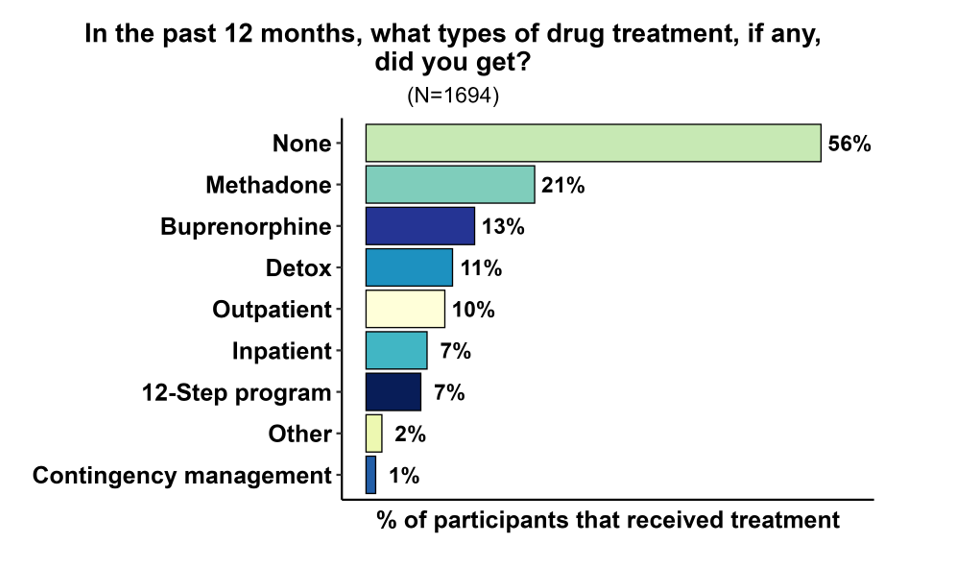
Among participants who used opioids, 20% were currently receiving methadone, 4% oral buprenorphine, and 1% injectable buprenorphine.
Participants were asked “In the past 12 months, was there a time you tried to get help to reduce your drug use but didn’t/couldn’t get it?” Twenty-six percent of participants responded yes and were asked “What got in the way of that happening?” Top reported barriers were: availability/access issues, personal motivation, being homeless, continued access to drugs, transportation, and family or personal barriers.
Table 12. "What got in the way" of trying to reduce or stop drug use? (N=415)
| n | % | |
|---|---|---|
| Availability/access issues | 78 | 19% |
| Personal motivation (couldn't follow through) | 64 | 15% |
| Continued use/access to drugs | 39 | 9% |
| Transportation | 34 | 8% |
| Family/relationships/social/pets | 32 | 8% |
| Negative interaction with support staff/ No follow up from providers |
26 | 6% |
| Being homeless | 24 | 6% |
| Restrictive program issues | 24 | 6% |
| No insurance/high cost | 19 | 5% |
| Medical | 15 | 4% |
| Unaware of available resources | 15 | 4% |
| Other | 14 | 3% |
| Incarceration/legal | 12 | 3% |
| Fear of withdrawal | 5 | 1% |
Desired services - SUD treatment and other help
There was a high level of interest in receiving mental or physical health care services at the SSP. Seventy-five percent of all participants would see a healthcare provider at the SSP, and 69% would see a provider for mental health. Low barrier health supports for people who use drugs at SSPs are available in some locations and a Health Engagement Program Resource Kit (UW ADAI) is available online, along with other resources.
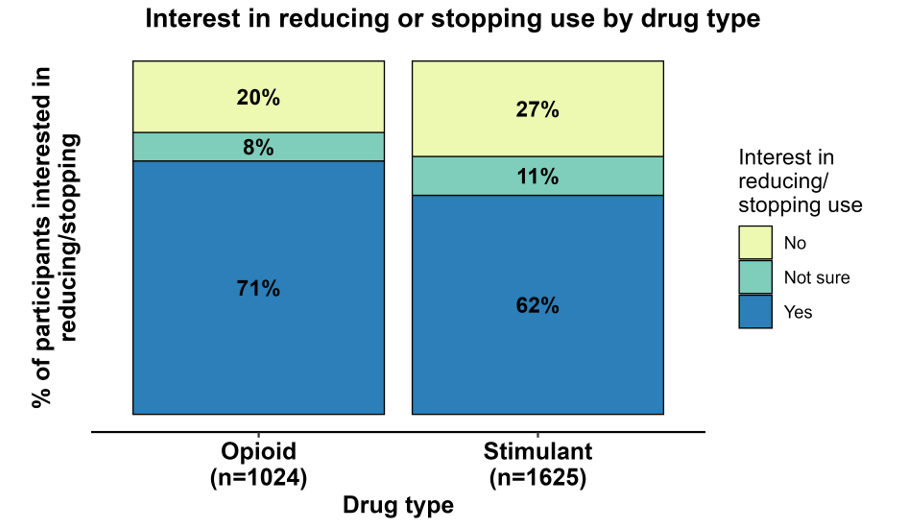
Most participants who used opioids (72%) or stimulants (62%) were interested in reducing or stopping their use.
Figure 15. Interest in reducing or stopping use by drug type
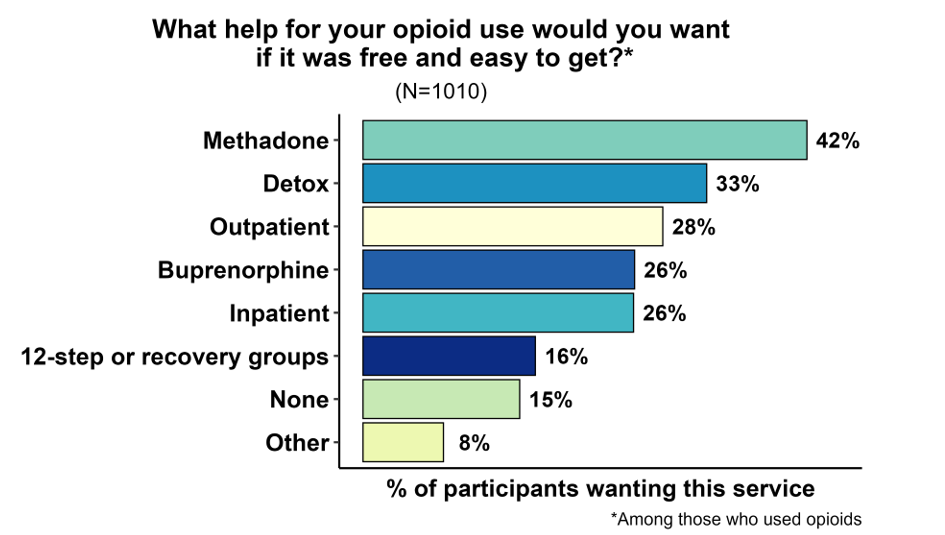
Participants who used opioids were asked “What help for your opioid use would you want if it was free and easy to get?” The top services desired by this group were: methadone (42%), followed by detox (32%), outpatient (29%), inpatient (26%), and Suboxone (buprenorphine) (26%).
Figure 16. What help for your opioid use would you want it if was free and easy to get? Select all that apply, (Among participants who used opioids)
Among participants who used stimulants, the most wanted “free and easy to get” supports were: “meds the might help reduce my use” (38%), “rewards for reducing/stopping stimulant use” (i.e., contingency management) (37%), outpatient care (37%), and “meds that might help with my mental health” (33%). A little less than a quarter were not interested in any services for their stimulant use.
Figure 17. What help for your stimulant use would you want if it was free and easy to get? Select all that apply. (Among participants who used stimulants)
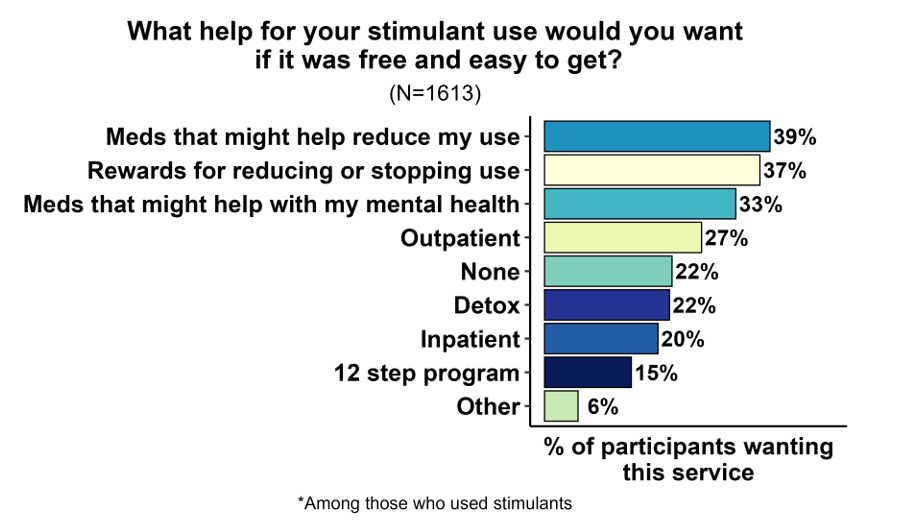
Notably, many of the services that people were most interested in for their stimulant use are not widely available, such as contingency management, an evidence-based treatment that can help people reduce their stimulant use.
Learn more
- Contingency Management for Methamphetamine Use: Qualitative Interviews at Harm Reduction Programs (UW ADAI)
- Contingency Management (WA HCA) Factsheet on CM.
- Treatment for stimulant use disorder (UW ADAI). Learn more about multiple approaches for supporting the health of people who use stimulants.
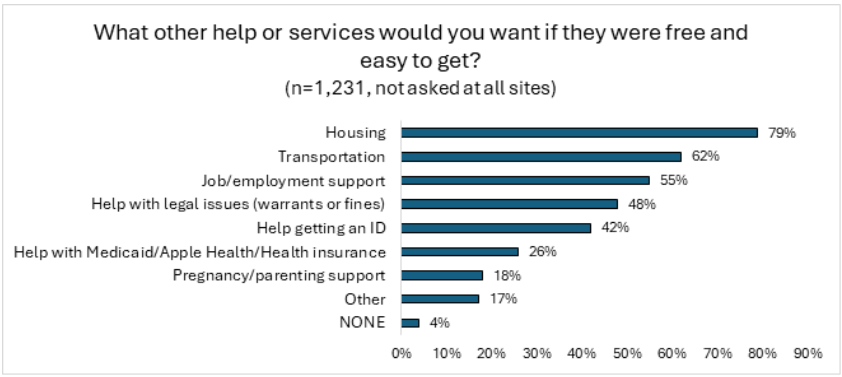
Participants were asked about non-drug-related ”help or services” they would want “if they were free and easy to get.” Top responses were: housing (79%), transportation (62%), job/employment support (55%), help with legal issues (warrants or fines) (48%), and help getting identification (42%). The percent of people who wanted help with legal issues was higher than the percent who had been incarcerated in the past year (37%), reflecting that people may have lingering legal issues they need support for.
Figure 18. What other help or services would you want if they were free and easy to get? Select all that apply.
Incarceration and MOUD
Thirty-seven percent of participants had been incarcerated in the past year; 36% had been in jail, and 2% in prison. There was overlap among those who had been in prison and those who had been in jail. Thirty-two percent of participants who had been in jail and used opioids were provided naloxone upon release from jail; note that people may not have mentioned their opioid use while incarcerated
Jail: Medications for opioid use disorder
MOUD in jail can help reduce opioid withdrawal, support recovery, and lower overdose risk on release. Most SSPs (19 out of 24) asked additional questions about participants’ experiences with MOUD in jail. Participants had been at jails across the state, and the length of stay ranged from 1-225 days.
Among participants who were regularly using opioids before jail (n=277), 23% were on MOUD, and 64% of those were offered a chance to continue their medication in jail.
Figure 19. Jail MOUD experiences
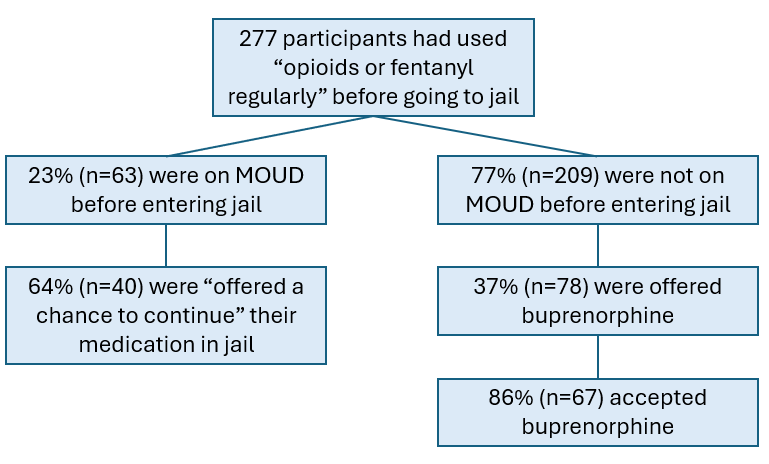
Among participants who were not on MOUD when they went to jail, 37% were offered buprenorphine, and 86% of those accepted it.
Learn more
- Medications for Opioid Use Disorder in WA State Jails - brochure from UW ADAI CEDEER
Recommendations
Support programs that help improve the health of people who use drugs. SSPs provide essential services that improve the health of people who use drugs and engage people who might not otherwise be receiving services. Currently, these programs serve a large population of unhoused people and have expanded the supplies they distribute to meet their needs. However, SSPs face challenges with funding and local support. Continued support for SSPs and other similar programs is critical for preventing the transmission of HIV and HCV and preserving these accessible spaces where people can receive care and support.
Support access to safer smoking supplies and other safer use supplies. Safer smoking supplies such as pipes and foils can help engage people in other services, like naloxone and wound care. They may also help people reduce or stop injecting, which can reduce the risks of HIV, HCV, and endocarditis.
Support the provision of additional services at SSPs through on-site physical and mental health and SUD services, and/or strong referrals. Participants expressed a high interest in mental and physical health services provided at an SSP. These programs are uniquely positioned to offer these services, particularly for people who will not or cannot access services in traditional care settings.
Expand access to and availability of methadone and buprenorphine for opioid use disorder, including in jails. Most people who used opioids wanted to reduce or stop their use. Interest in methadone was substantial, and there are new buprenorphine formulations that may be easier to start and sustain, like long-acting injectables. In areas where there is widespread availability of these new formulations, there is substantial interest from people with OUD. Federal regulations for methadone at opioid treatment programs have recently loosened, and many clinics have removed requirements for counseling and allow clients to take home medication doses (as opposed to making daily clinic visits) sooner. Mobile methadone, low-barrier buprenorphine, and other models exist to make access to MOUD easier.
Scale up services to support people who use stimulants. Almost all survey participants used stimulants, and most wanted to reduce or stop their use. Many were interested in medications to help cut back on their use or improve their mental health. There was also high interest in contingency management, an intervention that has been proven effective at helping to reduce stimulant use. The current focus has been on opioid overdose deaths, but these survey data, in addition to state mortality data showing an increase in deaths related to stimulant use, support the need to expand the focus to include services related to methamphetamine and cocaine use.
Limitations
This survey is administered at SSPs whose participants may be a unique subset of the broader, more diverse population of people who use drugs in Washington State. These data do not represent all people who use SSPs, or who use drugs, in Washington State. As a cross-sectional survey, these data describe circumstances at the time of the survey, and individuals surveyed are not linked over time. Therefore, data cannot be interpreted as changes in individuals over time. Also, because a sampling frame is not used and new sites joined the survey, population-level trends over time cannot be formally compared.
Resources
- Improve Lives, Prevent Deaths: A Guide to Help Communities Develop a Comprehensive Approach to Prevent Overdose Deaths and Improve the Health of People Who Use Opioids (UW ADAI)
- Community Surveys and Interviews: Find past Washington State syringe services program participant surveys and qualitative interviews. (UW ADAI)
- Washington State Opioid/Major Drug Interactive Data Pages (UW ADAI)
- Implementation Resource Kit for Health Engagement Programs, tools to help community organizations plan, implement, and sustain a health engagement program for people who use drugs (UW ADAI)
- Distribution of Safer Drug Smoking Supplies as a Public Health Strategy, (UW ADAI) Infobrief, updated January 2025.
Acknowledgements
ADAI would like to thank the many SSP participants who agreed to be surveyed and the SSP staff and volunteers who administered this survey. We also gratefully acknowledge our partners at Public Health – Seattle & King County and the Washington State Department of Health’s Drug User Health Team for their contributions and the Washington State Health Care Authority, Division of Behavioral Health and Recovery for its funding support.
REDCap use is supported by the Institute of Translational Health Sciences at the University of Washington; NIH awards to the institute did not provide direct funding for this project.
Cite this report: Newman A, Banta-Green CJ, Glick SN, Tinsley J, Moreno C. Results from the 2025 WA State Syringe Services Program Health Survey. Seattle, WA: Addictions, Drug & Alcohol Institute, Department of Psychiatry & Behavioral Sciences, School of Medicine, University of Washington, April 2026.