Results from the 2023 WA State Syringe Services Program Health Survey
Susan Kingston; Alison Newman, MPH; Caleb Banta-Green, PhD, MPH, MSW; Sara Glick, PhD, MPH
Download PDF of this report | Watch the webinar | Download the one-page summary
Key Findings
- 1,667 participants of Washington State syringe services programs (SSPs) completed a survey on their substance use, health behaviors, and health care and substance use treatment needs.
- Methamphetamine use among SSP participants was prevalent and frequent. More had used methamphetamine in the past week (89%) than fentanyl (61%), yet equal proportions (39%) identified either methamphetamine or fentanyl as their “main” drug. Most had used methamphetamine (62%) or fentanyl (51%) between 5-7 days of the past week.
- Prevalence of drug smoking among participants was high at all SSPs. Most (89%) had smoked a drug in the past week and 36% had both smoked and injected. Only 10% used drugs exclusively by injection.
- There was substantial use of safer smoking supplies at SSPs that distribute them and high interest among participants in getting safer smoking supplies at SSPs that do not yet distribute them.
- Housing was a crucial and substantial need among participants. Over half (55%) were living unhoused and 25% had only temporary/unstable housing. Among these individuals who did not have permanent housing, 68% said they would reduce or completely quit using their main drug if they had stable housing. 44% reported their “top need in life right now” to be housing.
- The majority of SSP survey participants were interested in reducing or stopping their stimulant and/or opioid use but face internal and external barriers to doing so. 32% said there was a time in the last 12 months when they “tried to get help to reduce their drug use but didn’t/couldn’t get it.”
- SSP participants wanted to receive additional services at their SSP including drug checking services, medical care, and behavioral health support. 75% said they would see a health care provider and 68% would see a mental health counselor at the SSP where they were taking the survey.
Syringe Services Programs in WA State
There are nearly 40 SSPs operating in urban, suburban, rural, and tribal areas across 30 counties in WA State. SSPs operate in brick-and-mortar sites; in mobile settings using vans, cars, and RVs; and through on-foot street outreach. The 2023 report Overview and Perspectives of Syringe Services Programs in WA State describes the range of services provided by SSPs and the various ways they operate. The WA State Department of Health (DOH) also maintains an online directory of WA State SSPs along with information on the background, legality, evidence base, and impact of SSPs.
Survey Overview
The WA State Syringe Services Program Health Survey is conducted every two years among participants of SSPs to learn about their substance use patterns, health behaviors, service utilization, and health care needs. The survey is coordinated by the Center for Community-Engaged Drug Education, Epidemiology & Research (CEDEER) at the University of Washington’s Addictions, Drug & Alcohol Institute (ADAI), in collaboration with Public Health-Seattle & King County (PHSKC) [1] and with support from the WA State Department of Health (DOH). See past survey results here.
Twenty-four organizations working in 25 counties chose to participate in the 2023 survey (Table 1) [2]. Two organizations were first-time participants in the survey. Between October 2023 and January 2024, SSP staff and volunteers administered the voluntary, face-to-face questionnaire with 1,667 participants who were at least 18 years old and reported past week drug use. Participants received a $10 gift card (provided by DOH) for completing the survey. View a map of participant zip codes, color coded by SSP organization.
Table 1: Participating organizations and number of surveys collected by county [3]. (Table 1 long description)
![Table 1: Participating organizations and number of surveys collected by county [3] See long description for details.](https://adai.uw.edu/wordpress/wp-content/uploads/table1-new.png)
[1] PHSKC uses a slightly modified version of the survey at its SSP sites to accommodate data needs particular to King County.
[2] All SSPs are invited to participate although not all elect to do so. Willapa Behavioral Health conducted surveys in Grays Harbor County, but the surveys were not received in time for this report due to mail delays.
[3] For more information about county-specific data, contact the participating organization(s) from that area.
Survey Results
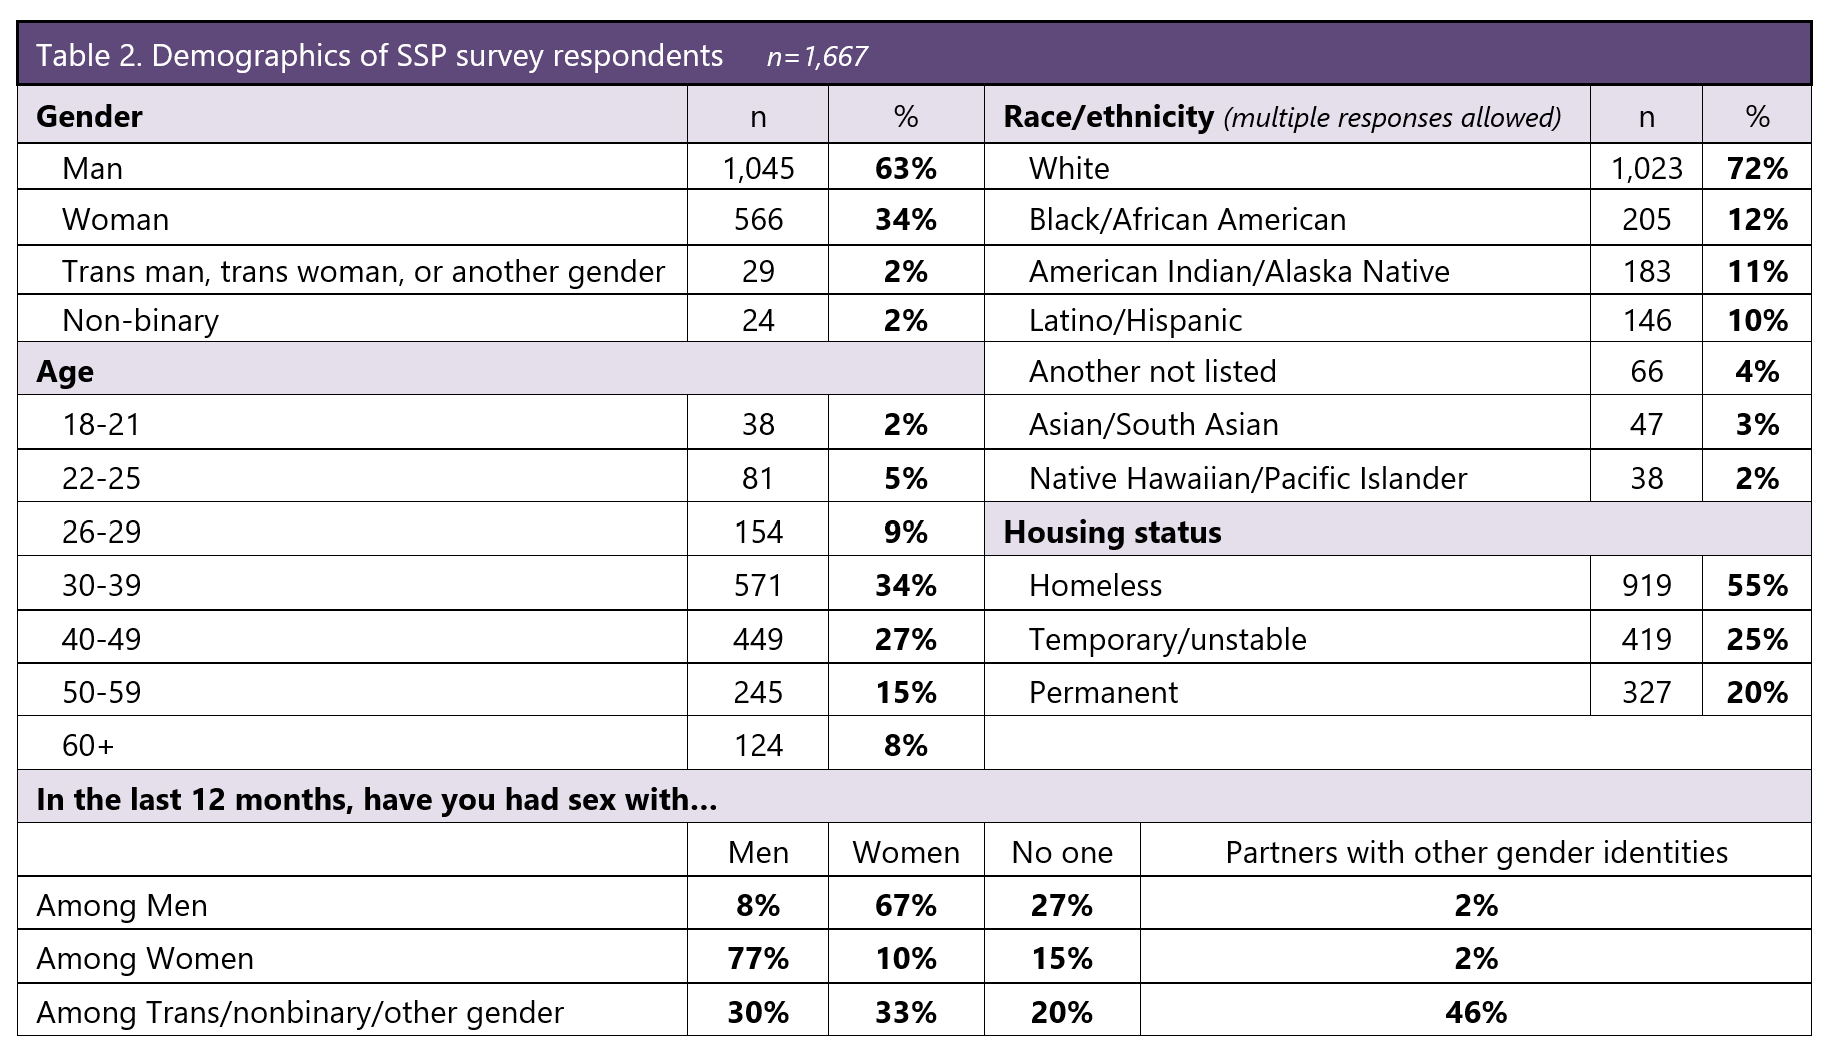
The majority of respondents identified as male (63%) and white (72%); these and other proportions of gender and race/ethnicity identities (Table 2) were consistent with past surveys. Respondents ranged in age from 18 to 75, with a mean age of 41 and a median age of 39. Only a minority (20%) had permanent housing; most were living unhoused (55%) or in temporary/unstable situations such as a tiny home village or “couch surfing” (25%). 8% were men who have sex with men and 10% were women who have sex with women.
Over half (56%) said they had used the SSP where they were taking the survey at least twice in the past 30 days; 12% were using that SSP for the first time on the day they took the survey.
Table 2: Demographics of SSP survey respondents, n=1667. (Table 2 long description.)
Incarceration
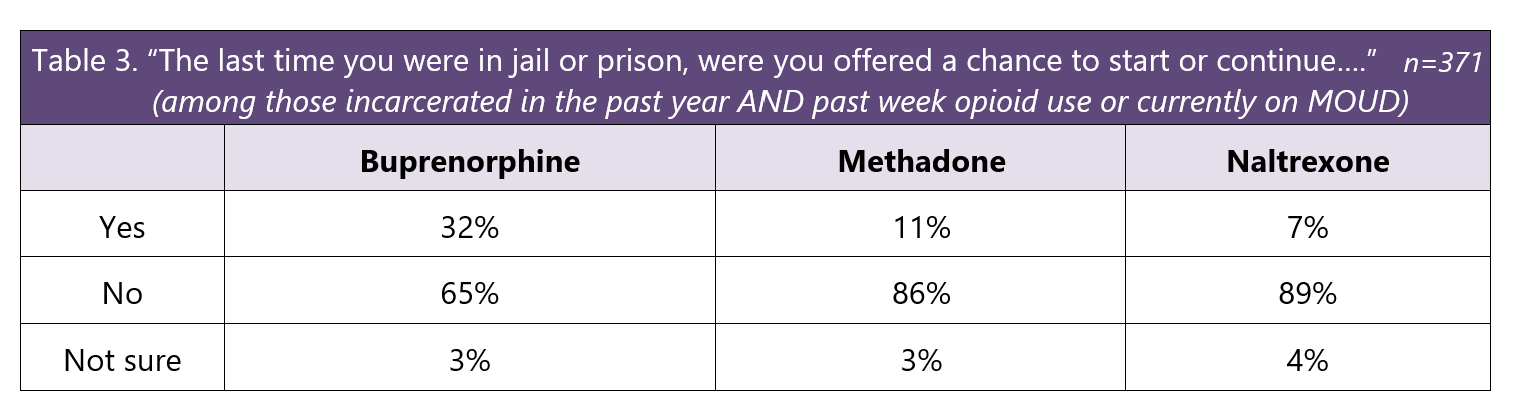
About a third (30%, n=502) of all respondents had been in jail or prison in the past year. Of these, 23% (n=115) reported they had been offered naloxone upon release. Among the 1,116 individuals who had used opioids in the past week or were currently taking medications for opioid use disorder (MOUD), a third (33%, n=371) had been incarcerated in the past year, of whom 28% had been offered naloxone upon release. A minority of these individuals said they had been offered a chance while incarcerated to start or continue MOUD (Table 3). The survey did not ask about incarceration type or length, so we cannot describe the impact of these important characteristics.
Table 3: "The last time you were in jail or prison, were you offered a chance to start or continue...," n=371 (among those incarcerated in the past year AND past week opioid use or currently on MOUD)
Past week drug use and “main” drug
Participants were asked about their use of methamphetamine, fentanyl, cocaine (powder or crack), heroin, and benzodiazepines [5]. More people had used methamphetamine (89%) in the past week than had used fentanyl (61%). Past week use of heroin or cocaine was much lower (Table 4). Equal proportions (39%) identified either fentanyl or methamphetamine as their “main drug” as they defined it.
Table 4: Substances used in past week compared to "main drug," n=1667. (Table 4 long description.)
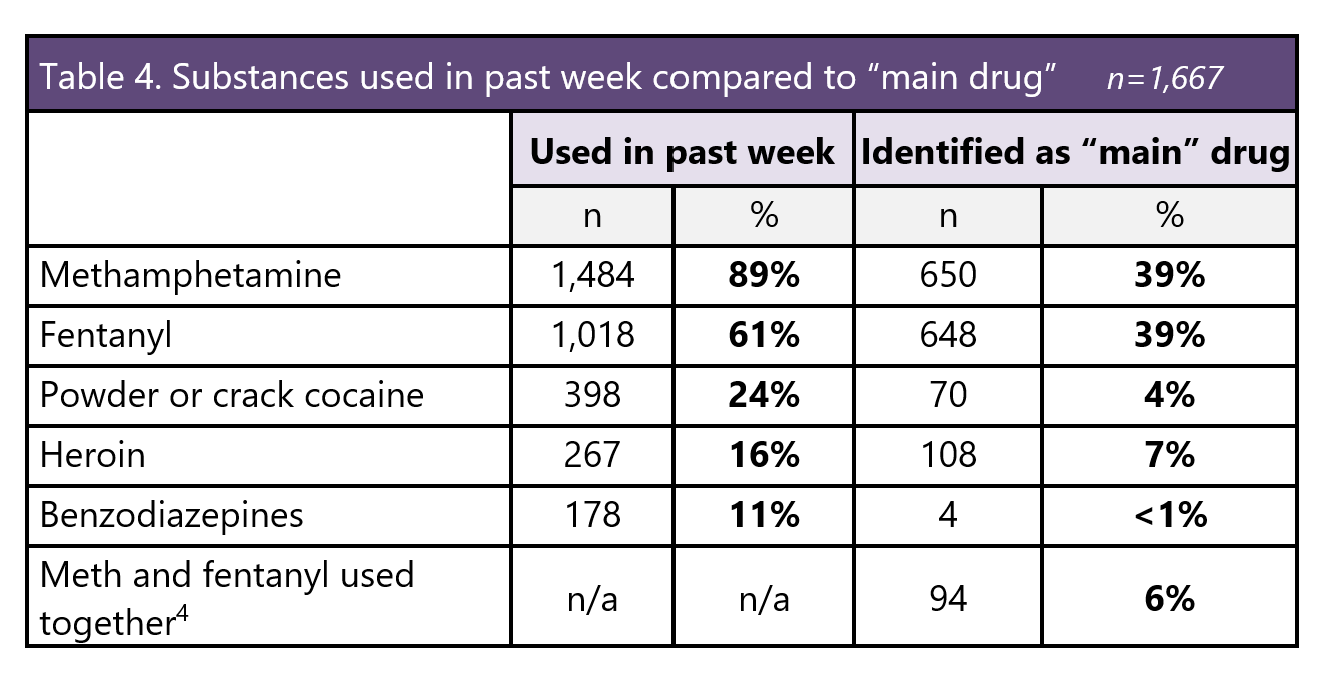
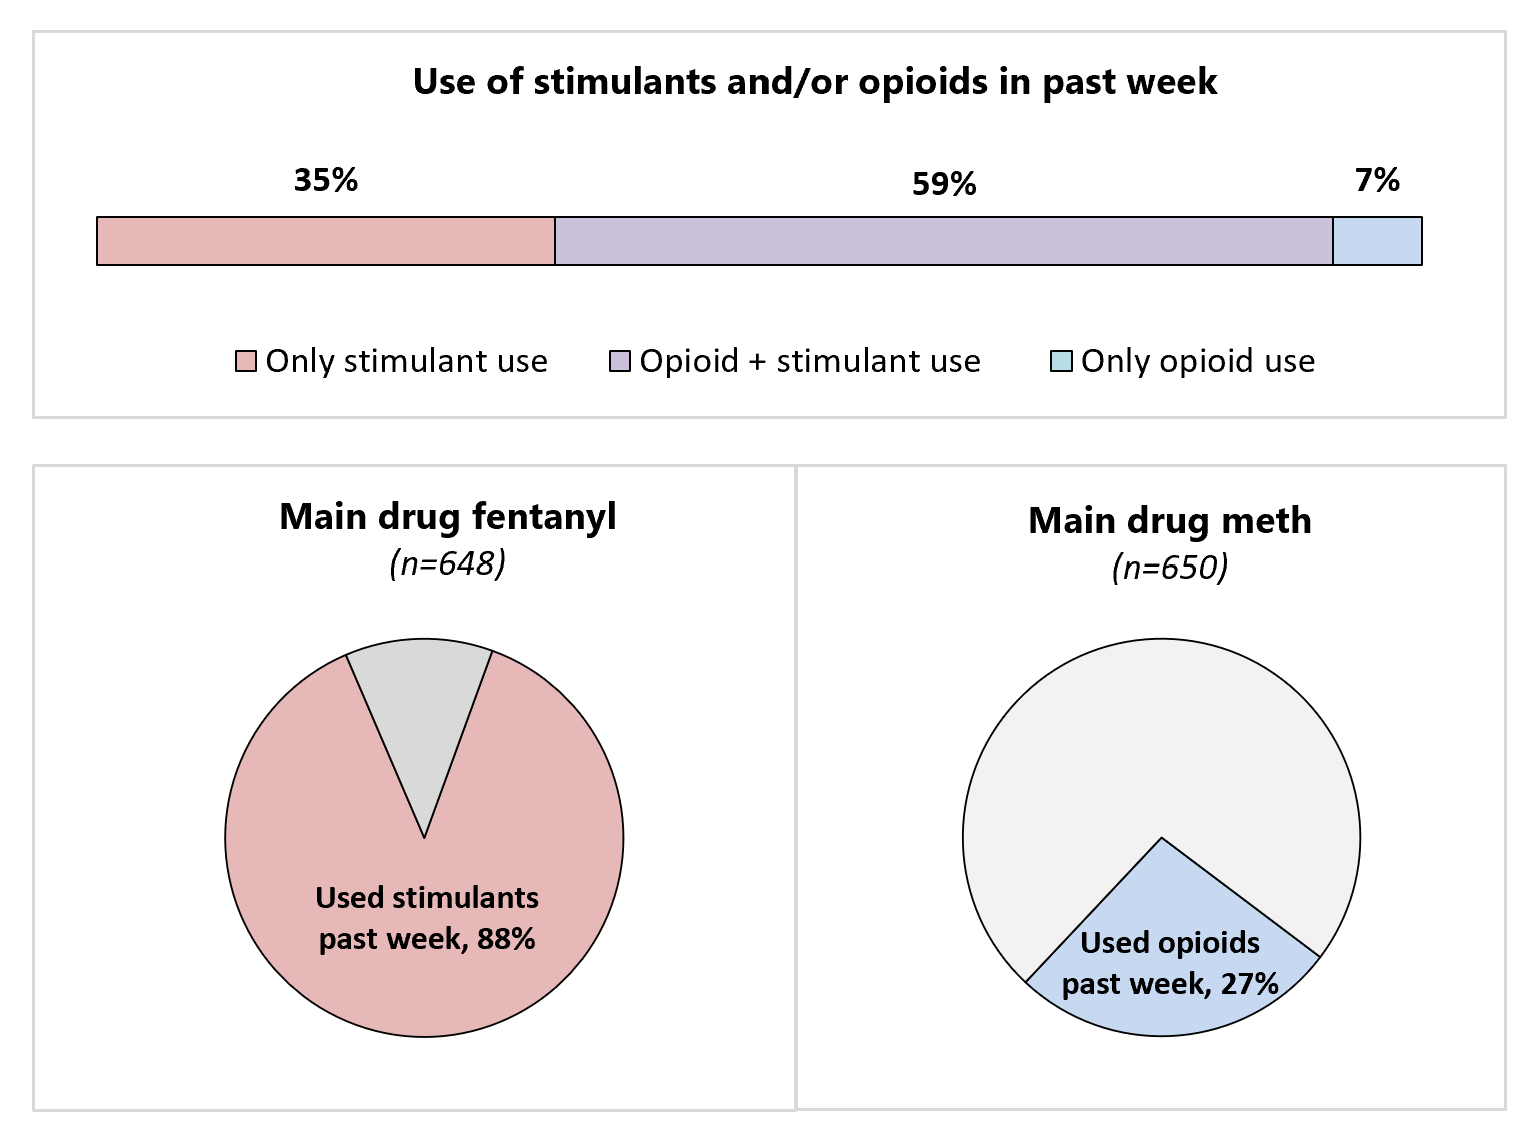
Figure 1 shows patterns of stimulant and/or opioid use among respondents. Over half (59%) had used both a stimulant and an opioid in the past week. Few people (7%) used only opioids in the past week. In fact, most (88%) of those who considered their main drug to be fentanyl said they had also used in a stimulant in the past week. Conversely, past week use of opioids among those whose main drug was methamphetamine was much lower (27%).
Figure 1: Patterns of stimulant and opioid use in the past week.
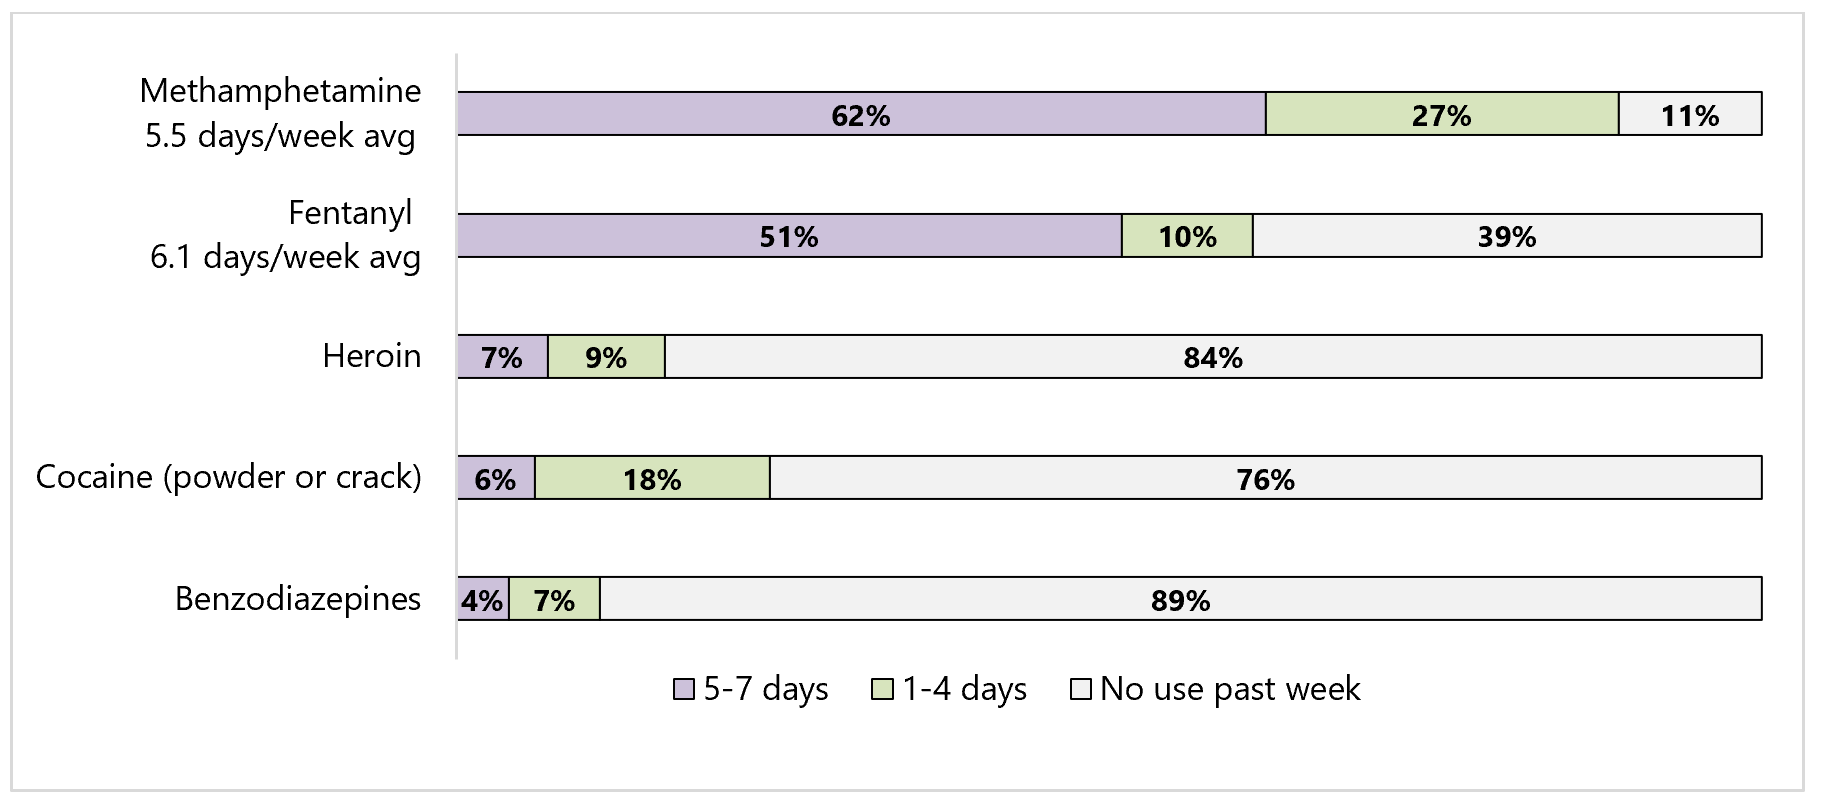
Frequency of drug use
Figure 2 shows the number of days respondents had used each drug listed in the past seven days. Most had used methamphetamine (62%) or fentanyl (51%) nearly every day (5-7 days) of the past week. The average number of days used was similar for both drugs, 5.5 days and 6.1 days respectively.
Figure 2: Frequency of drug use in the past 7 days, n=1667.
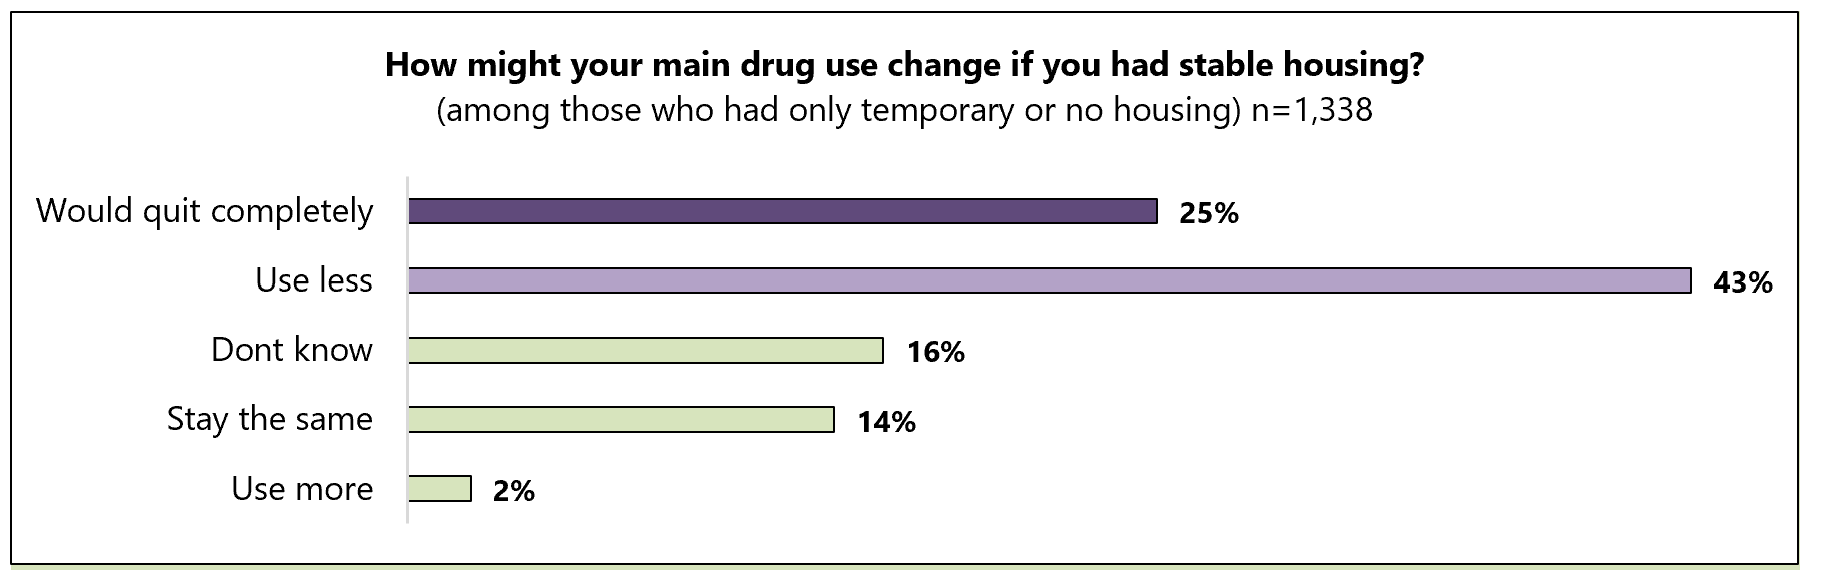
Participants who were living unhoused or in temporary/unstable housing (n=1,338) were asked “How might your main drug use change if you had stable housing?” (Figure 3). Many felt that stable housing would help them reduce use of their main drug (43%) or help them quit using their main drug altogether (25%).
Figure 3: How participants felt stable housing might impact their drug use.
[4] The PHSKC survey included “goofball” (i.e., methamphetamine and fentanyl/opioids combined) in the list of drugs used in the past week. Both statewide and PHSKC surveys included it as a “main drug” option.
[5] Use of other substances has been documented in previous surveys done by ADAI CEDEER.
Drug injection
Just under half of participants (47%) said they had injected any of the drugs listed in the past week (Figure 4) and only a minority used drugs exclusively by injection (10%). Of those who said they had injected any drug in the past week:
- 17% reported any syringe sharing in the past 3 months.
- 24% reported having an abscess or skin/soft tissue infection in the past 3 months.
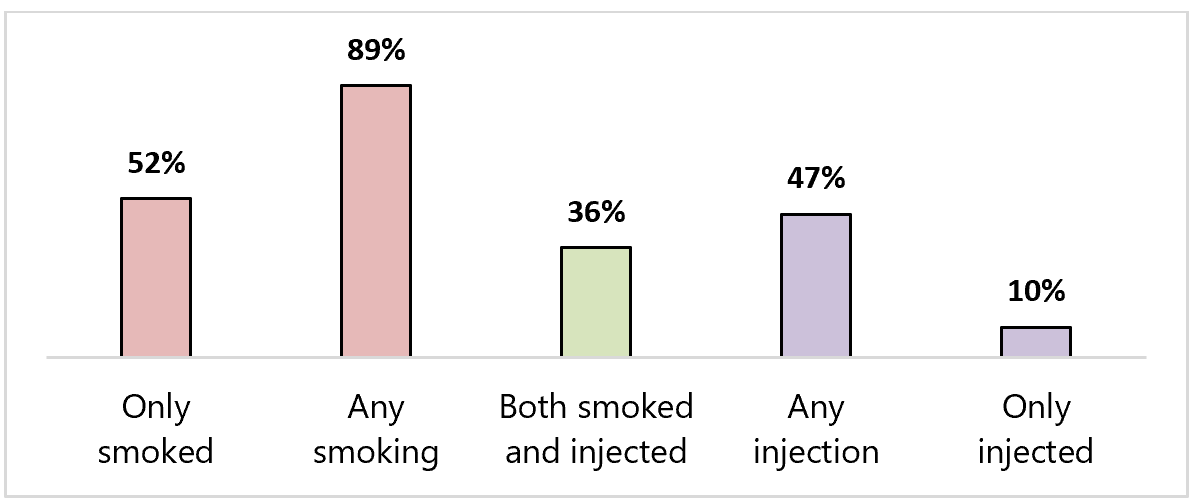
Drug smoking
Drug smoking was far more prevalent than drug injection. The majority of respondents (89%) had smoked any of the drugs listed in the past week and about a third (36%) had both smoked and injected one of those drugs in the past week (Figure 4). Over half (52%) used drugs by smoking only.
Figure 4: Routes of drug administration in the past week, n=1667
Compared to previous years, these data reflect a significant shift from majority injection to majority smoking. This change has been documented widely and largely reflects the displacement of heroin (typically injected in WA State) by fentanyl (typically smoked) in the local drug market and perhaps more people who smoke drugs coming to SSPs to obtain safer smoking supplies.
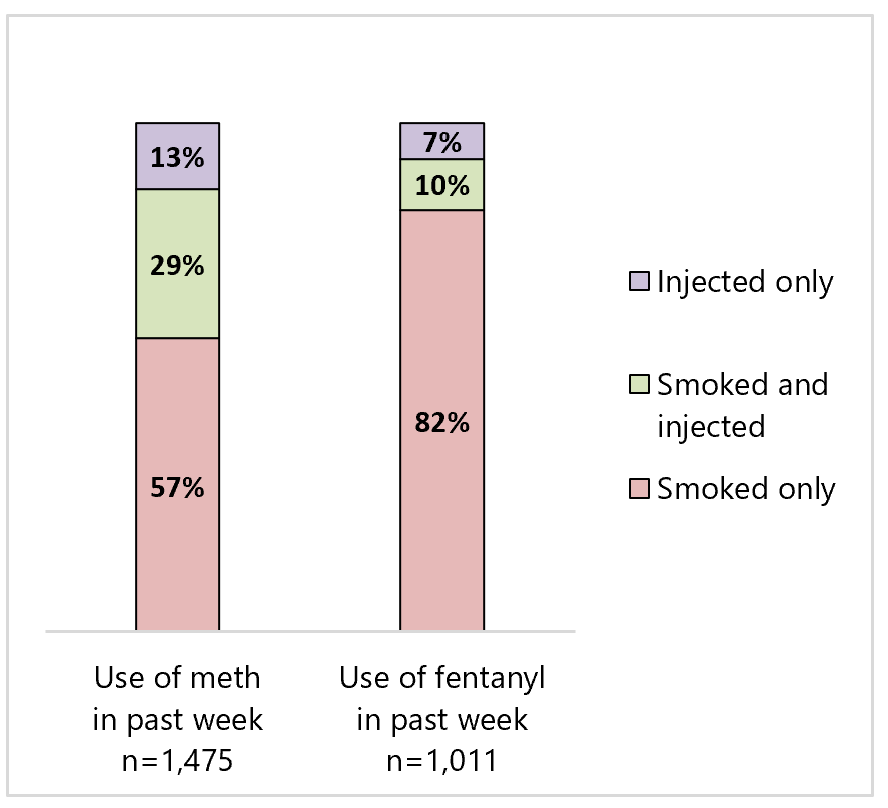
Figure 5 shows how participants had used either methamphetamine or fentanyl in the past week. Most participants reported using either drug only by smoking. A smaller proportion reported both injecting and smoking, and a minority used either drug by injection only.
Figure 5: Injecting and/or smoking of methamphetamine or fentanyl among those who had used either.
Interest in safer smoking supplies
As drug smoking has become more prevalent, many SSPs are distributing safer smoking supplies (in addition to sterile injection equipment) to provide an alternative to higher-risk drug injection and reduce the spread of infectious disease via smoking. This has also been an important way to attract and connect new individuals to harm reduction education, personal support, and linkage with health care, behavioral health, and substance use treatment services [6]. At the time of the survey, nine SSP organizations were providing safer smoking supplies; these organizations represented 988 respondents who had smoked a drug in the past week. The remaining 15 SSP organizations were not yet providing safer smoking supplies, although many are interested or preparing to do so. These organizations represented 489 respondents who had smoked a drug in the past week.
Figure 6 shows the prevalence of drug smoking among participants is high at all SSPs sites, no matter if that program distributed safer smoking supplies or not.
Figure 6: Percentage of participants who smoked a drug in past week, by SSP type.
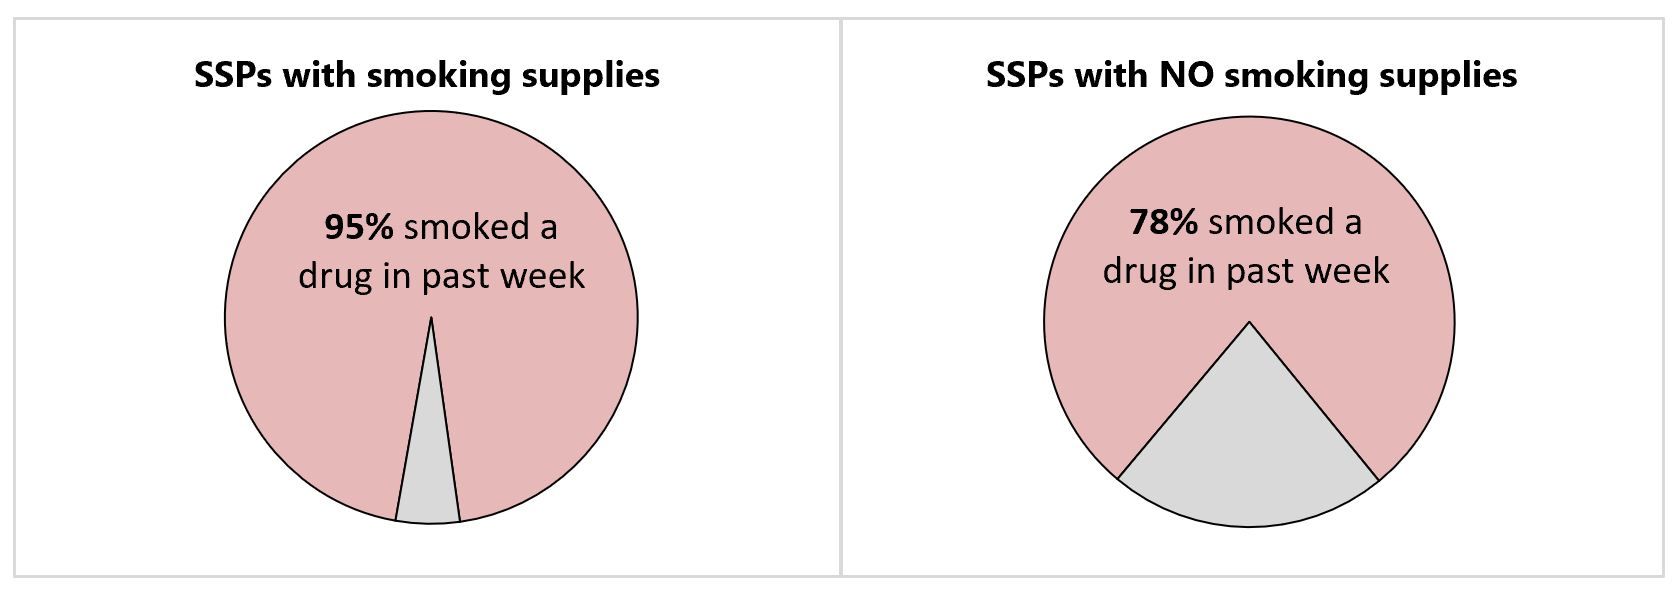
Overall, there was very high use of smoking supplies at SSPs that distributed them and great interest in getting safer smoking supplies at SSPs that do not yet distribute them.
- At SSPs with safer smoking supplies, 84% of participants who had smoked drugs in the past week had gotten smoking supplies at their SSP in the past year.
- At SSPs without safer smoking supplies, 90% of participants who smoked drugs in the past week were interested in getting safer smoking supplies at their SSP.
[6] More information is available in Singh S, Banta-Green C, Kingston S. Distribution of Safer Drug Smoking Supplies as a Public Health Strategy. UW ADAI, January 2022.
84% percent of respondents reported carrying a naloxone kit in the past three months; the percentage was slightly higher (91%, n=1,011) among those who had used an opioid in the past week.
Figure 7: Number of opioid overdoses had in past 3 months, among those who had used opioids or were on MOUD, n=1,116
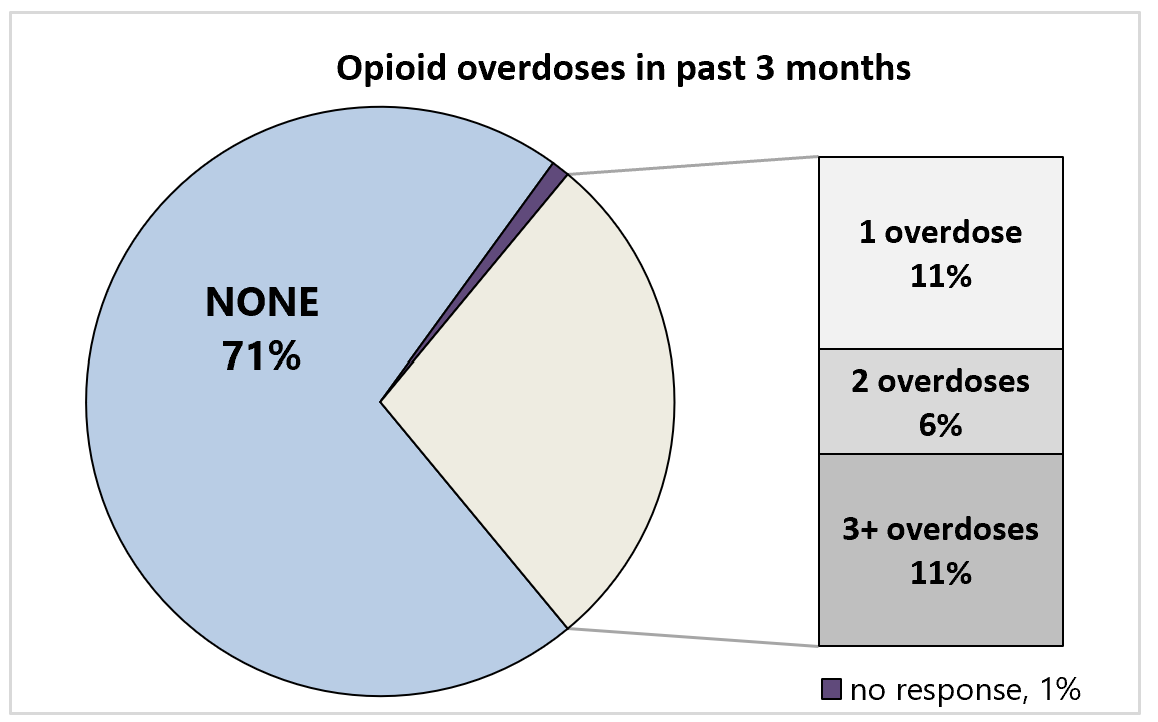
Among participants who had used an opioid in the past week or who were currently on MOUD (n=1,116), 28% had experienced at least one opioid overdose in the past three months (Figure 7). Overdose was defined in the survey as “where your breathing slowed down or stopped, you couldn’t wake up, or someone had to Narcan you.” The percentage who reported having at least one opioid overdose in the past three months was higher among those who were also homeless (32%) and among those who had also been in jail or prison in the past year (39%).
Figure 8: Number of ER/urgent care visits in past year.
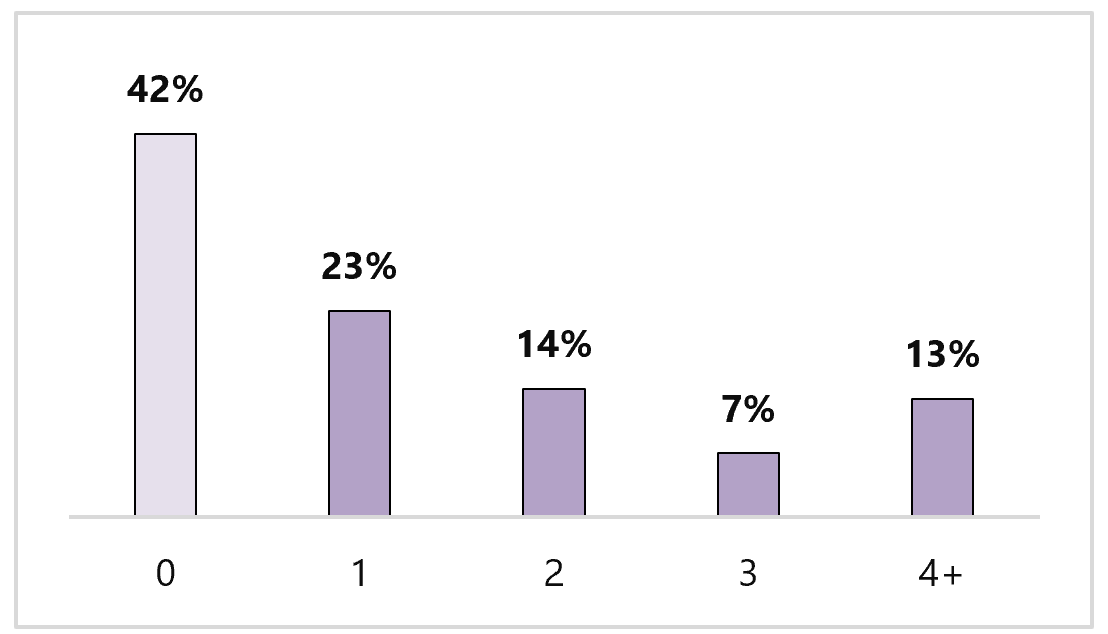
The majority of respondents (91%) had some type of health insurance, predominantly Medicaid (82%). Just over half (58%) reported they had been in the emergency room (ER) or urgent care at least once in the past year.
Communicable disease testing
Testing for HIV or hepatitis C virus (HCV) was common:
- 89% had ever been tested for HCV, 40% within the past year. A quarter (25%) of those ever tested had been diagnosed with HCV.
- 89% had ever been tested for HIV, 43% within the past year.
Only 30% had been tested for syphilis in the past year. Cases of primary and secondary syphilis have increased significantly in WA State, disproportionately impacting many populations, including people who use drugs.
Interest in health care services at SSPs
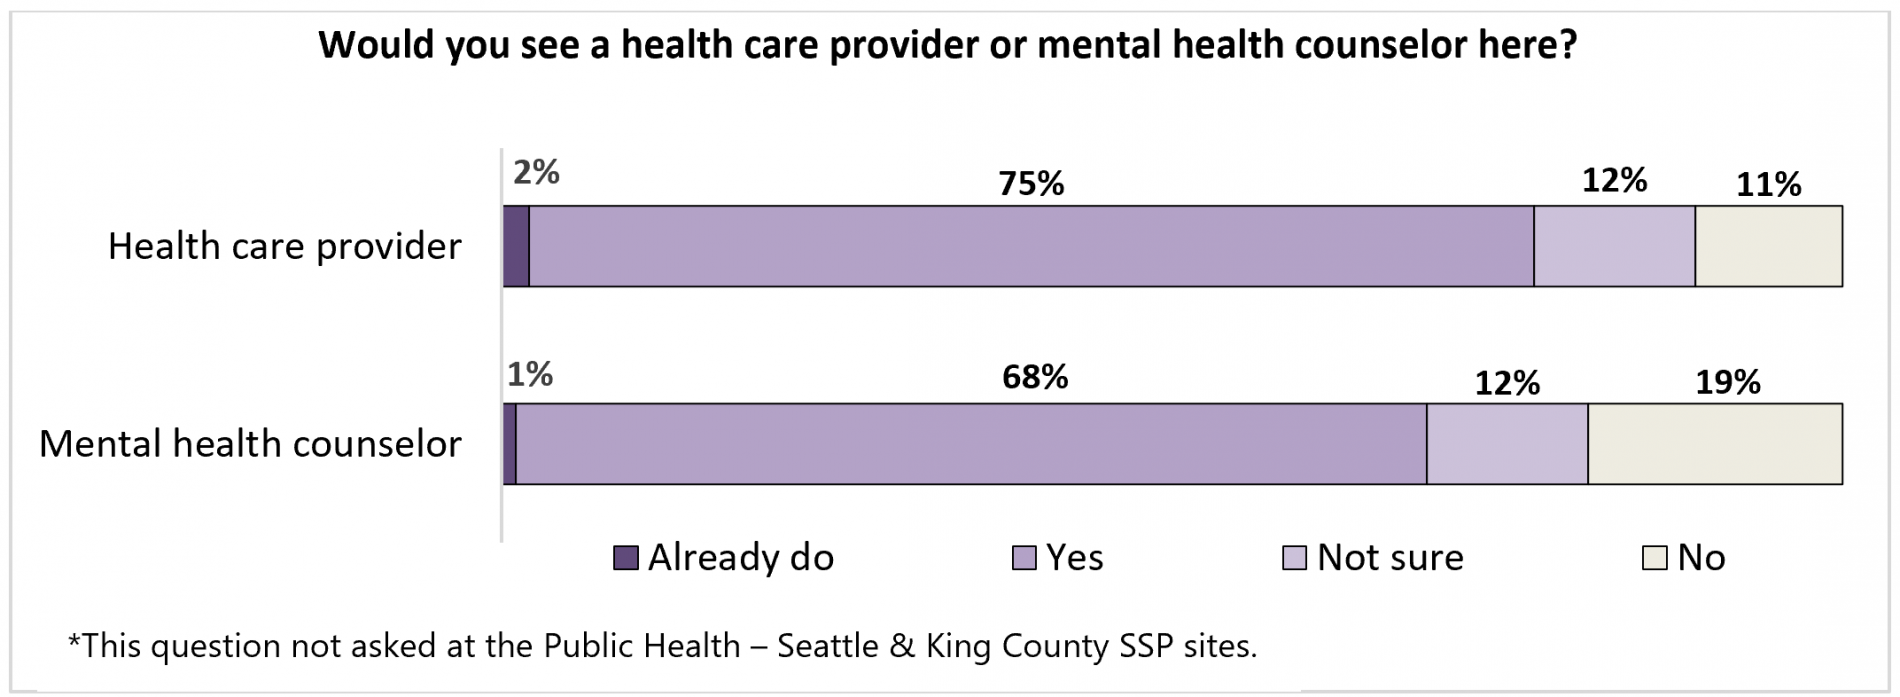
Over half (55%) reported there was a time in the past year when they “thought they should see a health care provider but did not go.” While the 2023 survey did not ask the reasons for not seeking needed healthcare, the 2017 WA State SSP Health Survey showed the most common reasons to be distrust of medical providers and fear of being judged for using drugs [7]. The majority of participants, however, said they would see either a health care provider (75%) or a counselor for mental health support (68%) at the SSP where they were taking the survey (Figure 9). A few SSPs currently offer some level of onsite health care, mental health support, and/or access to same-day MOUD.
Figure 9: Willingness to access health care services located at SSPs.
[7] Banta-Green C, Newman A, Kingston S. Washington State Syringe Exchange Health Survey: 2017 Results. Seattle, WA: UW ADAI, 2018.
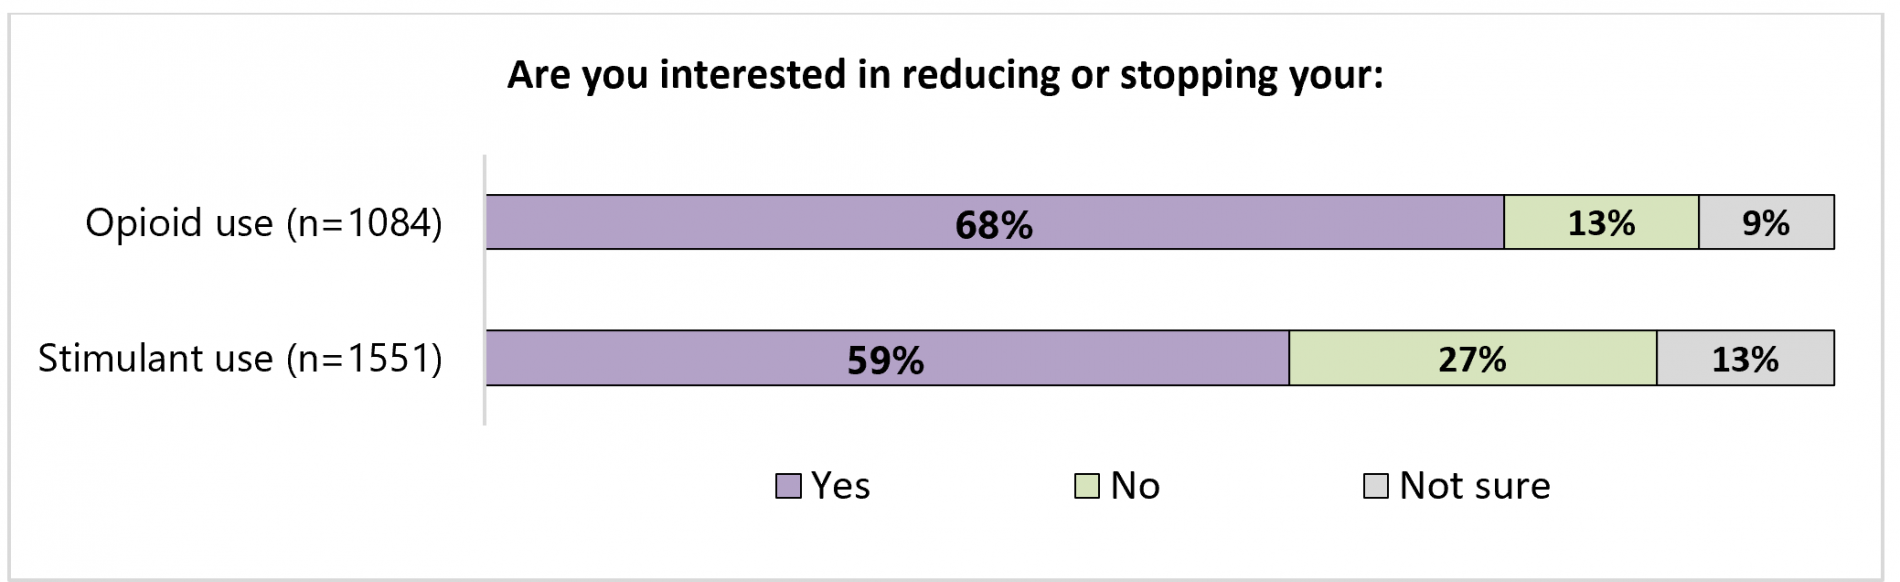
The majority of respondents were interested in reducing or stopping their use of stimulants and/or opioids. About two-thirds (68%) of those who had used an opioid in the last week were interested in reducing or stopping their opioid use (Figure 10). Slightly fewer (59%) of those who had used a stimulant in the past week were interested in reducing or stopping their stimulant use.
Figure 10: Interest in reducing or stopping drug use, among those who had used opioids or stimulants in the past week.
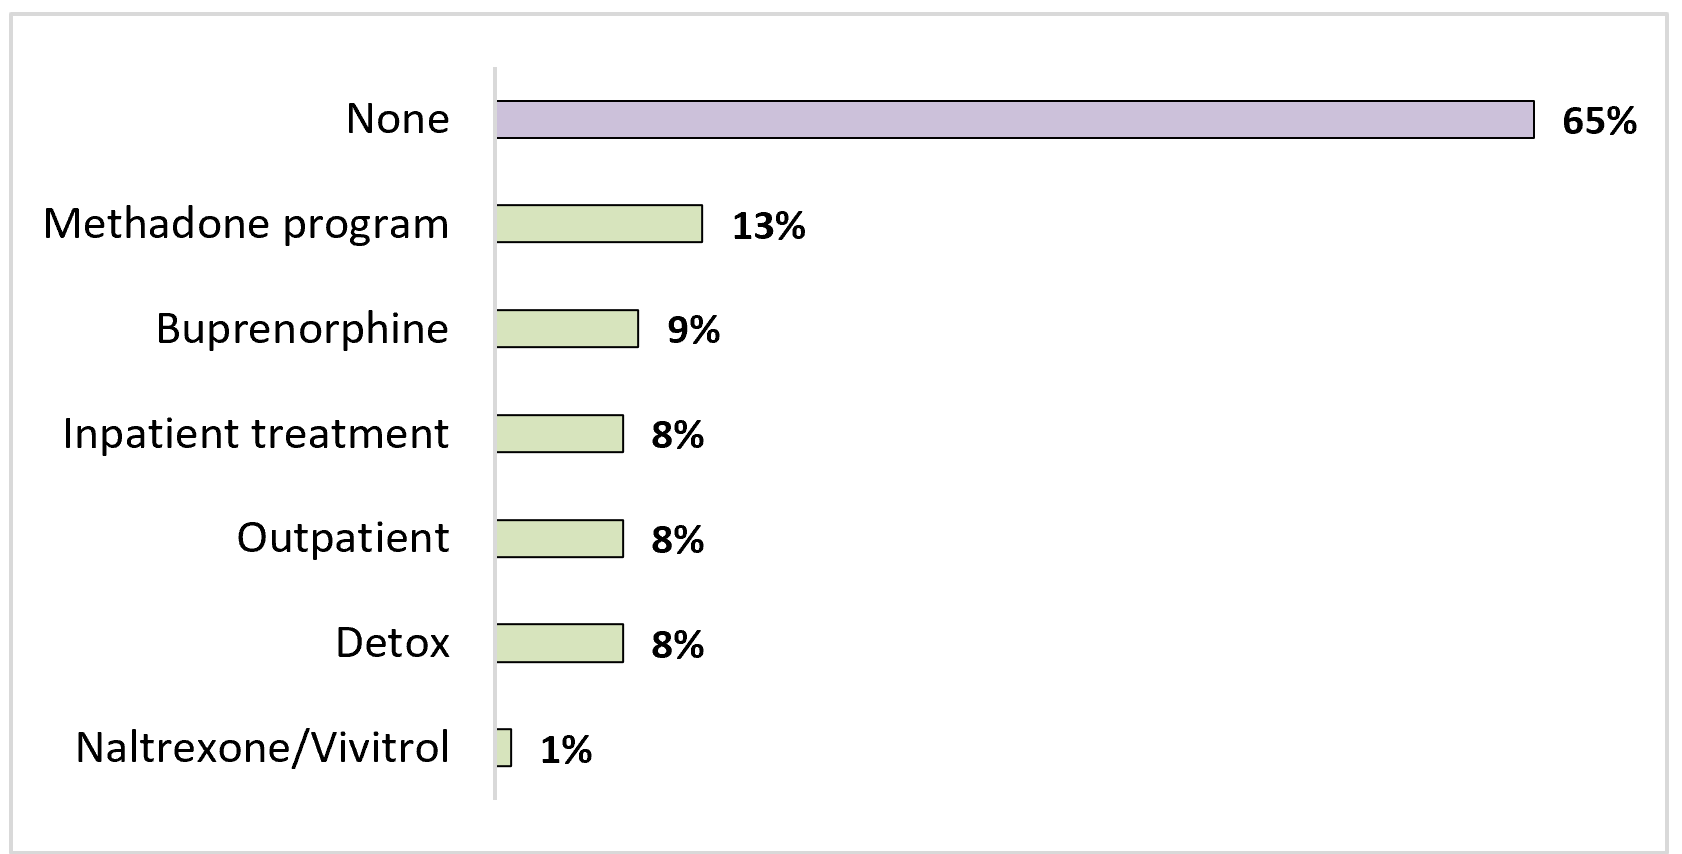
Over a third (35%) of respondents had utilized at least one type of substance use treatment or support group in the past 12 months (Figure 11). At the time of the survey, a minority of all respondents were currently taking medications for opioid use disorder (methadone, 9%; buprenorphine, 5%; naltrexone, <1%).
Figure 11: Drug treatment/supports used in past 12 months, n=1667.
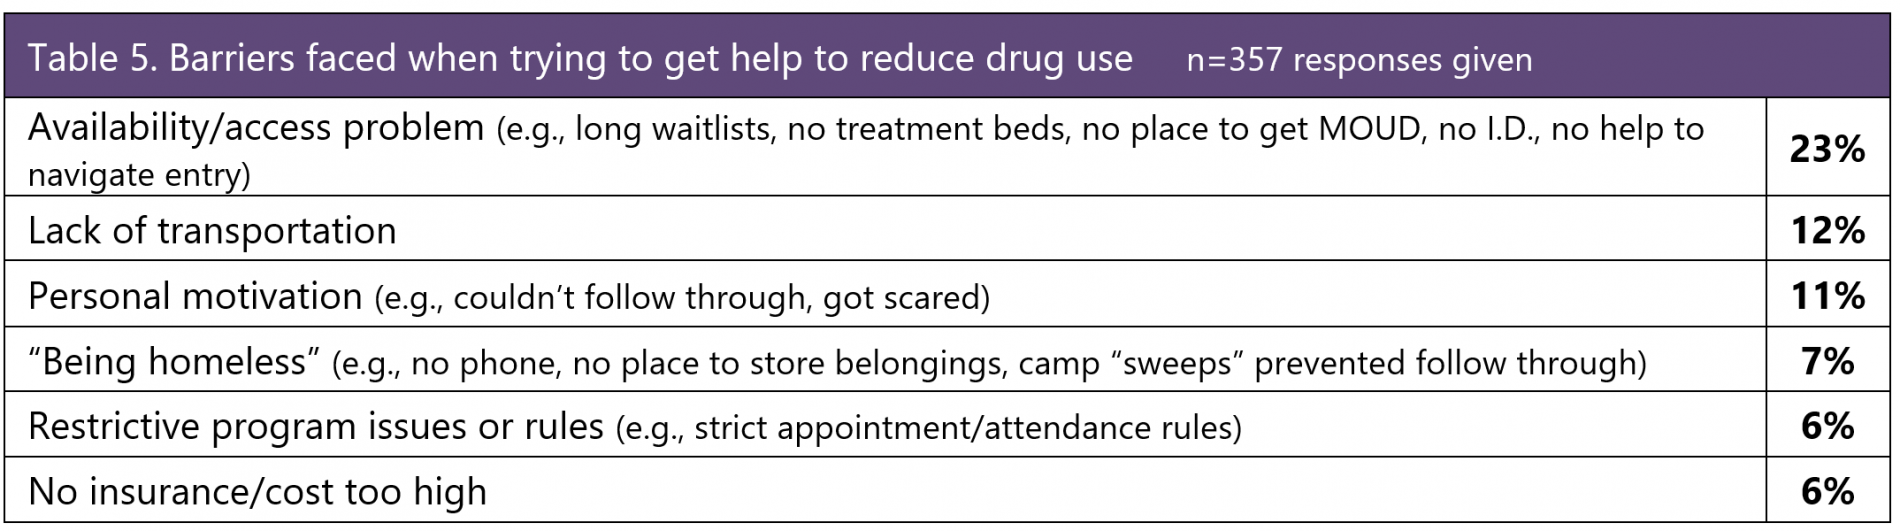
About one-third (32%) said there was a time in the last 12 months when they “tried to get help to reduce their drug use but didn’t/couldn’t get it.” These participants were then asked, “What got in the way of that happening?” and their open responses were coded into the categories below (Table 5). Other common barriers mentioned included mental health issues, withdrawal side effects too hard to deal with, could not stop using, partners not also able to stop or get into treatment, legal issues, and other health problems.
Table 5: Barriers faced when trying to get help to reduce drug use, n=357 responses given.
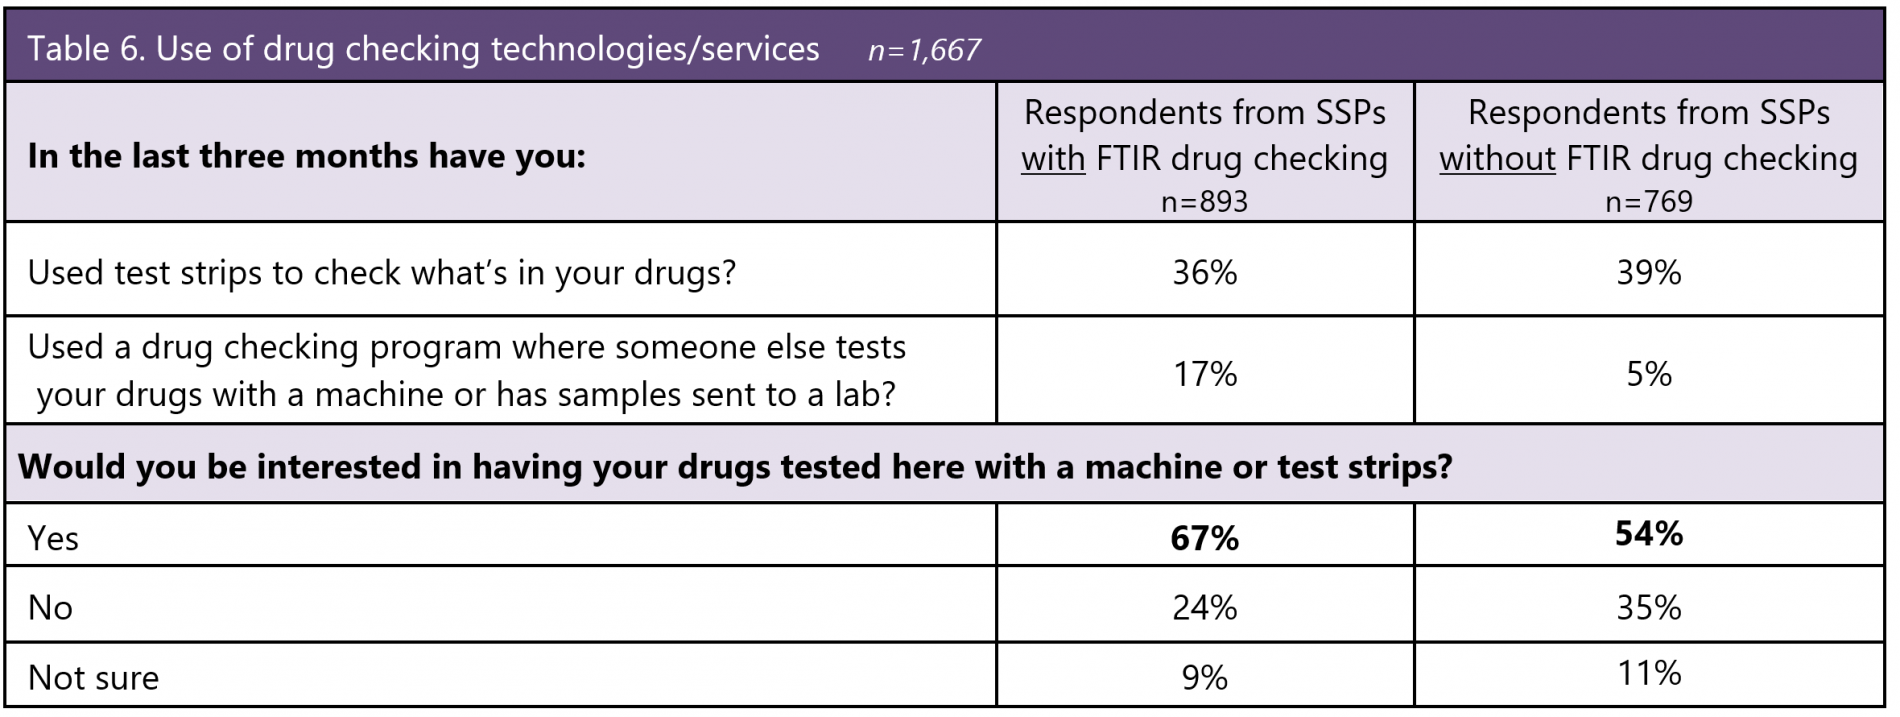
Community-based drug checking [8] provides ways for people who use drugs to analyze the chemical contents of drug residue so they can make safer, more informed choices about if or how they may use that drug. SSPs in WA State distribute immunoassay test strips so participants can self-test their drugs for fentanyl and xylazine [9]. At the time of this survey, six SSP organizations were also providing point-of-care drug checking for their participants using Fourier-transform infrared (FTIR) spectroscopy, with samples sent to a laboratory for secondary testing.
Only about one-third of respondents at either type of SSP (FTIR drug checking or no FTIR drug checking) had used a “test strip” themselves to check their drugs (Table 6). At SSPs with onsite FTIR drug checking, 17% of respondents had used the service, a notable measure of uptake given that the service was still somewhat new (<6 months) for most sites. Overall, the majority of respondents said they were interested in having their drugs tested at their SSP.
Table 6: Use of drug checking technologies/services, n=1667. (Table 6 long description)
[8] Learn more about drug checking in WA state in Kingston S, Biamont B, Banta-Green C. The Use and Impact of Community Drug Checking Services. Seattle, WA: UW ADAI, November 2023.
[9] Benzodiazepine and methamphetamine test strips are available but not distributed by local SSPs.
Using These Data in Policy and Practice
The findings of this survey provide essential and current information for SSP staff, policy makers, and service providers to better understand the complex needs of people who use drugs and to design and adapt services that are relevant, welcoming, and easier to access.
- The high prevalence of stimulant use among people who use opioids reinforces the need to address opioid use, opioid overdose risk, and treatment of opioid use disorder within a polysubstance use context.
- Given the high prevalence of drug smoking and the greater health risks from drug injection, all SSPs should be supported by policy and funding to distribute safer smoking supplies.
- Housing is a crucial and substantial need, and most participants said that stable housing would have a positive impact on reducing or stopping their drug use.
- SSPs can be ideal places to provide primary and/or behavioral health care for people who use drugs because participants already have trusting relationships with staff, they are already coming for harm reduction/other supports, and services are often much easier for them to access at SSPs (e.g., location, hours, walk-up access) than at traditional health care settings.
- While over half (55%) of participants said they needed, but did not seek, health care in the past year, it is notable that fewer than 5% of respondents ranked “health issues” or “health care” as their top life need. Efforts to increase availability of low-barrier health care (e.g., health engagement hubs) may need to give equal emphasis to providing services to address other survival needs and/or navigators to assist access to non-health services.
- Finally, this survey highlights the importance of involving people who use drugs in meaningful ways to design and deliver the services offered to them. People who use drugs have clear preferences, insights, and innovative ideas for service models and are eager to share their perspectives when given genuine opportunities for input and involvement.
Limitations
This survey is administered at SSPs whose participants may be a unique subset of the broader, more diverse population of people who use drugs in WA State. These data do not represent all people who use SSPs, or use drugs, in WA State. As a cross-sectional survey, these data describe circumstances at the time of the survey, and individuals surveyed are not linked over time. Therefore, data cannot be interpreted as changes in individuals over time. Also, because a sampling frame is not used and new sites joined the survey, population-level trends over time cannot be formally compared.
Acknowledgements
ADAI would like to thank the many SSP staff and volunteers who helped administer this survey and the SSP participants who agreed to be surveyed. We also gratefully acknowledge our partners at Public Health – Seattle & King County and the WA State Department of Health’s Drug User Health Team for their contributions and the WA State Health Care Authority, Division of Behavioral Health and Recovery for its funding support.
How to cite this report: Kingston S, Newman A, Banta-Green C, Glick S. Results from the 2023 WA State Syringe Services Program Health Survey. Seattle, WA: Addictions, Drug & Alcohol Institute, Department of Psychiatry & Behavioral Sciences, School of Medicine, University of Washington, April 2024. URL: https://adai.uw.edu/download/9208/