Opioids are a class of drugs that bind to opioid receptors and have opioid-type effects similar to the classic compound morphine. There are many types of opioids and they differ in important ways including how strong the drug is, how quickly it takes effect, and how long it lasts. Heroin is a drug long used internationally and in Washington State, despite associated negative health outcomes and its status as a Schedule 1 drug (illegal in the United States). Fentanyl is a synthetic opioid used medically for severe pain and during surgery. It is a schedule 2 drug and can be prescribed or dispensed for medical purposes. Over the last two decades fentanyl has also been manufactured illicitly, initially occasionally, and since approximately 2014 with much greater frequency. "Fentanyl" can be an umbrella term, including fentanyl itself as well as various analogues of fentanyl (a.k.a. fentalogs), some of which are legal. While all fentanyls are generally more potent than heroin, potency varies widely.
According to the CDC, in 2015 synthetic opioids other than methadone (mostly fentanyl) surpassed heroin among drug overdose deaths in the U.S. As of 2020 fentanyl, suspected to be almost entirely illicit, was the most common drug detected in fatal drug overdoses in many cities and states. In Washington State fentanyl-involved drug overdose deaths are increasing, and data from the WA State Department of Health indicate that by late 2021 they surpassed psychostimulants with abuse potential (mostly methamphetamine) in contributing to drug poisoning deaths. On this page we provide a detailed analysis of drug-caused deaths involving fentanyl to provide some insights into use in Washington State. Although there have been media reports of fentanyl being directly shipped via package delivery services, most of the fentanyl in the US is reportedly coming from Mexico via regular criminal drug shipment routes. We examine evidence from law enforcement seizures below. The data (crime lab and death) do not distinguish between legal and illegal fentanyls.
The data are complex and imperfect, including issues regarding drug identification and inconsistencies over time. We provide detailed descriptions of data sources and data issues at the bottom of this page.
As a reference point, we present overall opioid-involved drug poisoning data for the state. Similar to national trends from the CDC and others, we compare opioid-involved drug poisonings involving heroin, commonly prescribed opioids, and other synthetic opioids, the most common of which are fentanyl and its anologues. Pharmaceutical opioids have declined after 2006 as heroin increased, and starting in 2016 other synthetic opioids started increasing.
Press the "Death rates" button to see rates per 100,000 residents, and the "Percent of opioid deaths" to see what percentage of all these deaths involved each of the three main subtypes. As noted above, specification of opioids into subtypes in death certificate data has improved over the years. Thus, part of the increase in the share of opioid deaths involving heroin was due to better documentation of heroin by medical examiners. Many opioid deaths involve multiple opioids, and so these rates and percentages are not mutually exclusive.

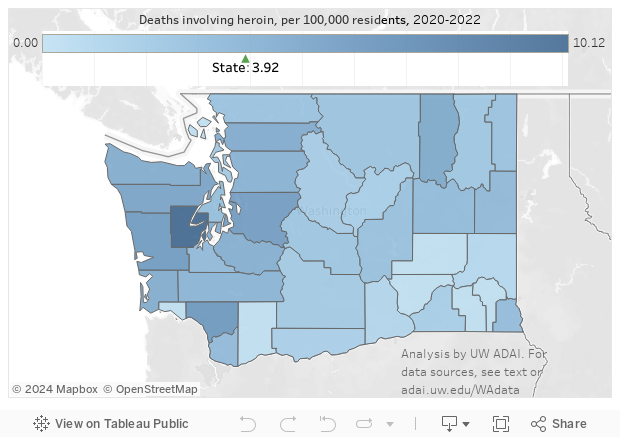
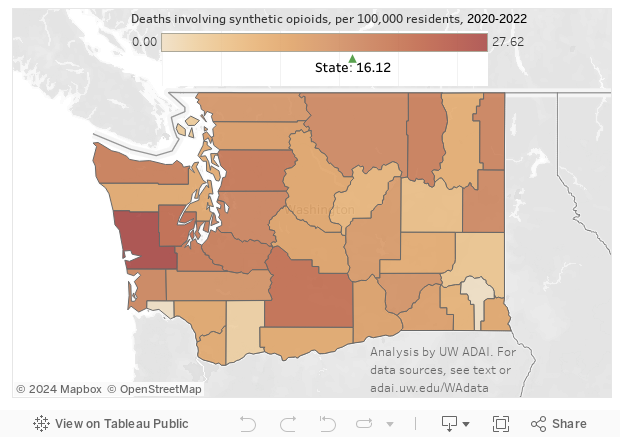
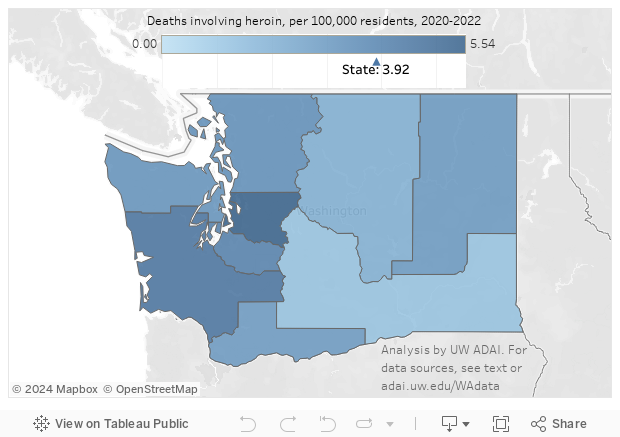
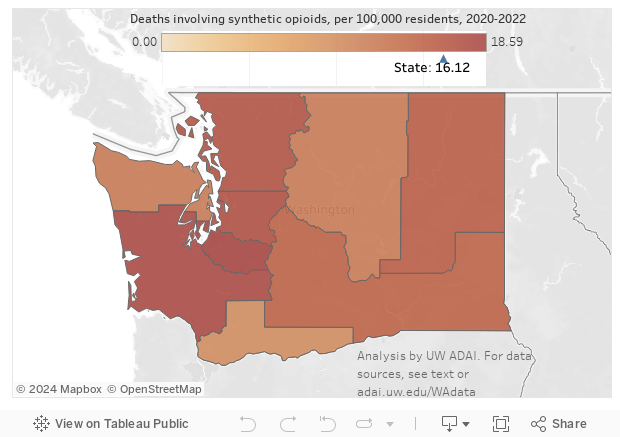
The maps below allow you to compare the spread of heroin deaths versus those drug poisonings involving the synthetic opioids category.
Drug poisonings involving opioids often involve more than one type of opioid, and often involve other substances as well. In the graphic below, we present the percentage of all opioid poisonings involving the pair of drugs or drug categories listed (ignoring the presence of all other drugs). See our major drug deaths page for more about this data visualization. Fentanyls are again represented in the "Other synthetic opioids" category. The time trends in the first graphic above show a clear increase in heroin deaths after 2010, and in fentanyl deaths after 2015. We provide two co-ingestant matrices, for 2024-2025 and for a period before this earlier increase in heroin deaths, to allow comparison of the types of drugs present in opioid deaths before and after apparent major changes in the predominant type of opioids. The rows and columns are ordered from largest to smallest proportion of drug deaths, that is alone or in combination.
The early period, 2006-2008, was approximately the peak of prescription-type opioid deaths, so among the classes of drugs shown here methadone and other commonly prescribed opioids (hydrocodone, oxycodone, etc.) are the two most prominent types. Antidepressants were also commonly present, while methamphetamine was relatively rare. The synthetic opioid category appeared without any other drug category presented in 2% of all opioid deaths, and was never paired with heroin. The drug categories presented here accounted for over 96% of drug poisonings involving opioids (the rest likely involved the "Other and unspecified narcotics" code [T40.6]).
In contrast, in the most recent period (click the 2024-2025 button), the drug classes presented account for nearly 99.9% of opioid deaths (due in part to better specification of the type of opioid involved). The other synthetic opioids category is now the most common drug class (having taken over from heroin after 2018), with 20% of opioid deaths involving just this class with no other drug type presented here, 3.5% the synthetics with other commonly prescribed opioids, and less than 1% the synthetics in combination with heroin. The most common pair is other synthetic opioids with methamphetamine (56%), a combination that has grown greatly in prominence (up from 23% in 2020-2021).
We analyze and present the data above ignoring the source of the fentanyl or other synthetic opioid. While fentanyl has been used for decades in surgery settings, and some fentanyl analogues are legally available, a police evidence testing case that tests positive for sufentanil or a death involving fentanyl is counted regardless of whether the substance was prescribed or administered to the person involved, diverted from a licit source or manufactured illicitly. The recent increases in crime lab cases and deaths are clearly, however, due to illegal manufacture and distribution. Below we compare cases and deaths involving synthetic opioids (as rates per 100,000 residents) and legally distributed amounts from the DEA's ARCOS database (as total daily doses per resident for the year). We include both legally distributed fentanyl itself and the less common meperidine, which is technically included in the "other synthetic opioids" category but rarely seen in drug poisonings as it is much less potent than heroin. The rise in synthetic opioid deaths since 2015 has come during a downward trend in legal sales of fentanyl. (Turn off the deaths and cases series, by clicking on the series names in the legend, or zoom in on the years before 2018 to better see this.)
2025 death data are preliminary and may change.
We use a shorter time period for "recent" (2024-2025) than the past comparison period (2006-2008) for coingestant analyses. The larger period provides more deaths, stabilizing proportions, while the shorter "current" period--which still has more drug poisonings--gives a better picture of current circumstances.
Drug-caused deaths are based on individual-level death certificate data from the state Department of Health. We restrict analysis to drug poisonings (based on ICD-10 codes X40-X44, X60-X64, X85, and Y10-Y14 as the underlying cause of death) involving Washington residents who died in Washington. This common definition excludes cases where alcohol poisoning or alcoholism, carbon monoxide poisoning, etc., was coded as the underlying cause of death. Alcohol deaths are thus drug poisonings also involving alcohol. (The state's review and confirmation of potential opioid cases, conducted from 1999 through 2015, has been eliminated from defining opioid deaths.) Many drug deaths involve multiple drugs, and identifying the single drug out of many that resulted in death is impossible. Thus, these deaths are best described as drug poisonings involving the drug or category of drugs specified.
To smooth out the effects of small counties and to correspond to the Department of Health's management of some public health programming through grouping counties into Accountable Communities of Health, we present death rates by ACH as well as by county.
Identification of heroin (ICD code T40.1) as a contributing cause of death is difficult and has improved over time, due in part to the state Department of Health working with local coroners and medical examiners to improve testing and reporting. This paper describes some of the difficulties (see sidebar). Identification of fentanyl analogues in the early years of illicit fentanyl distribution may have been incomplete due to lack of familiarity with specific chemicals as well as changes in laboratory testing and reporting procedures.
Following the lead of the CDC, among opioids we focus on deaths specifically involving heroin (T40.1), methadone (T40.3), other commonly-prescribed natural and semisynthetic opioids (oxycodone, codeine, morphine, etc.; T40.2), and other synthetic opioids (T40.4), most prominent among them being fentanyl and fentanyl analogues. There is no ready way to identify fentanyl deaths other than using this ICD code, which may catch deaths involving other synthetics such as pethidine and tramadol. The increase in recent years of the number of deaths involving this code, however, indicates that most of them involve one of the fentanyls. In our data in 2016--2018, a random sample of 100 drug poisonings with this code found that 79 indeed involved a fentanyl. The remaining cases included 12 deaths involving tramadol, 5 involving buprenorphine, 1 each with meperidine and U-47700 (a novel synthetic opioid often lumped together with the fentanyls), and 2 were improperly coded and did not belong in this category. A similar sample of 2022 deaths found 98 of 100 had one or more fentanyls listed.
Identification of methamphetamine deaths is based on searching written information saved in the electronic death certificates for relevant words containing "meth" and/or "thamphet", including innumerable misspellings of methamphetamine. This written information ("literals") is available back to 2003. All other drug categories shown are based on coding of contributing causes of death to specific ICD T-codes.
Crime lab cases are the results of the Washington State Patrol's Forensic Laboratory Services Bureau chemistry testing of samples submitted by law enforcement. While the data provide important insights into the supply of drugs, in part due to the use of precise chemical testing which indicates exactly which substance is present, they also have numerous important limitations, which we describe elsewhere. As with toxicology testing in deaths, identification of novel synthetic opioids may have lagged behind availability of such substances. See our new and emerging drugs in crime lab evidence page for an explanation of why crime lab cases dropped in 2021.
Legal drug distribution: See our ARCOS page for information about the DEA's counting of opioids legally distributed to hospitals and pharmacies and conversion to daily doses.