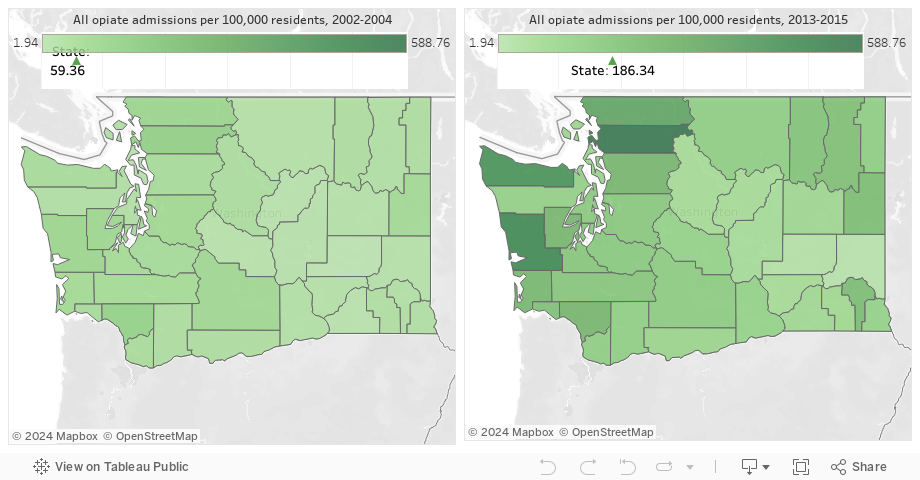
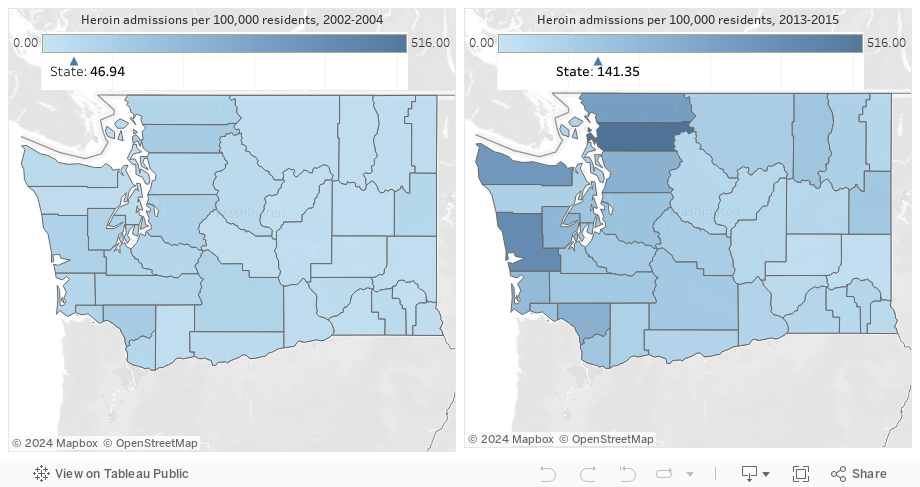
Treatment data from the Washington State Division of Behavioral Health and Recovery (in rates per 100,000 residents) reflect publicly funded treatment via outpatient, intensive inpatient, recovery house, long-term residential, and opiate use disorder treatment medication modalities, for which the primary substance is listed as heroin, oxy/hydrocodone, prescribed opiate substitute, non-prescription methadone, or other opiate. Department of Corrections treatment excluded.
Treatment admission rates depend on users identifying and acting upon a need for treatment and the availability of treatment. The growth in admissions in a particular county may thus be due to a growth in users, public health outreach to get more users into treatment, an increase in the number of treatment slots available, or some combination of all these factors.
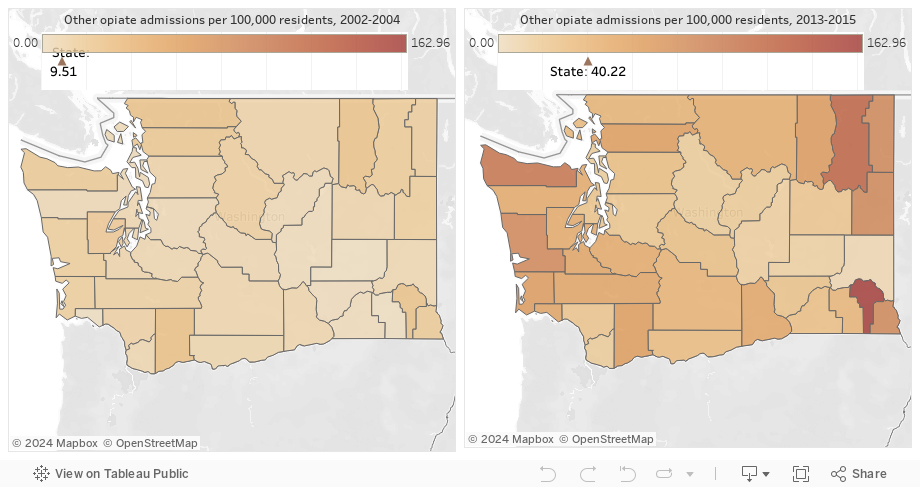
This chart allows you to compare the share (among opiate subtypes) of heroin versus prescription-type (Rx) or other opiates, by county, over time. The size of the bubble is the overall all opiate admission rate (per 100,000 residents). A bubble above an imaginary 45° line (i.e. with a slope of 1) from the origin (lower left) means more than half associated with heroin. A bubble on the horizontal axis means all prescription-type. You can select one or more counties to focus on before clicking the play button (lower left) to watch how that county and others changed over time. Select the STATE bubble to see how counties compare to the state-wide rates over time.
While rates of treatment admissions for which the primary drug was a non-heroin opiate increased in most counties between 2002-2004 and 2013-2015, the motion chart above shows that the rate in the latter period is generally below peaks seen in 2008 or 2009.
In the chart below, we present the above data for the state as a whole as yearly rates over all years available. We add data on yearly average caseloads for one type of intervention, opiate treatment programs (OTPs).
Buprenorphine is an alternative to methadone for medication-assisted treatment of opiate addiction. It is available by prescription from an authorized physician. In 2013, approximately 300 physicians who were authorized to prescribe buprenorphine for addiction wrote a prescription for at least one patient; this is among the more than 500 Washington doctors who were approved to write such prescriptions. In the map below, buprenorphine prescriptions are assigned to counties by a proportional matching algorithm developed by Looking Glass Analytics to apportion ZIP code population or events to counties. The rate of physicians who prescribe buprenorphine and the number of patients for whom they prescribe varies greatly by county. For the 15,042 people who received buprenorphine in 2013 and for whom a residential ZIP code was available, the map indicates that the rate of buprenorphine prescribing was lower in Eastern Washington, but not uniformly so.